Bahamian vs Immigrants from Zimbabwe Seniors Poverty Over the Age of 75
COMPARE
Bahamian
Immigrants from Zimbabwe
Seniors Poverty Over the Age of 75
Seniors Poverty Over the Age of 75 Comparison
Bahamians
Immigrants from Zimbabwe
15.5%
SENIORS POVERTY OVER THE AGE OF 75
0.0/ 100
METRIC RATING
300th/ 347
METRIC RANK
11.7%
SENIORS POVERTY OVER THE AGE OF 75
85.5/ 100
METRIC RATING
118th/ 347
METRIC RANK
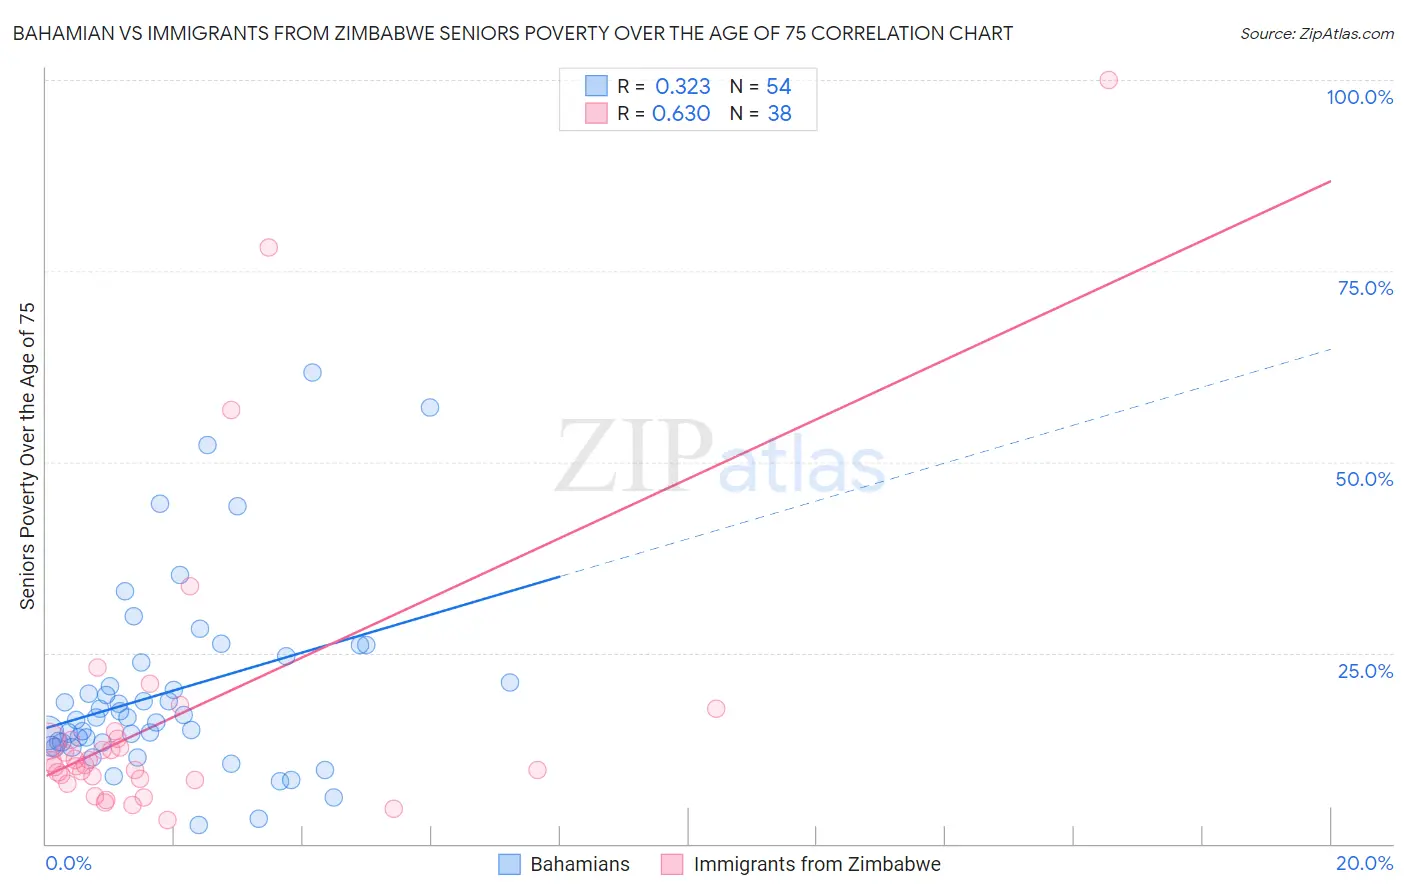
Bahamian vs Immigrants from Zimbabwe Seniors Poverty Over the Age of 75 Correlation Chart
The statistical analysis conducted on geographies consisting of 112,239,118 people shows a mild positive correlation between the proportion of Bahamians and poverty level among seniors over the age of 75 in the United States with a correlation coefficient (R) of 0.323 and weighted average of 15.5%. Similarly, the statistical analysis conducted on geographies consisting of 117,364,236 people shows a significant positive correlation between the proportion of Immigrants from Zimbabwe and poverty level among seniors over the age of 75 in the United States with a correlation coefficient (R) of 0.630 and weighted average of 11.7%, a difference of 32.1%.
Seniors Poverty Over the Age of 75 Correlation Summary
| Measurement | Bahamian | Immigrants from Zimbabwe |
| Minimum | 2.5% | 3.1% |
| Maximum | 61.7% | 100.0% |
| Range | 59.2% | 96.9% |
| Mean | 20.0% | 16.7% |
| Median | 16.5% | 10.5% |
| Interquartile 25% (IQ1) | 13.3% | 8.5% |
| Interquartile 75% (IQ3) | 23.7% | 13.7% |
| Interquartile Range (IQR) | 10.4% | 5.2% |
| Standard Deviation (Sample) | 12.4% | 19.8% |
| Standard Deviation (Population) | 12.3% | 19.5% |
Similar Demographics by Seniors Poverty Over the Age of 75
Demographics Similar to Bahamians by Seniors Poverty Over the Age of 75
In terms of seniors poverty over the age of 75, the demographic groups most similar to Bahamians are Spanish American Indian (15.5%, a difference of 0.010%), Native/Alaskan (15.5%, a difference of 0.11%), Honduran (15.4%, a difference of 0.45%), Yuman (15.4%, a difference of 0.73%), and Immigrants from Latin America (15.6%, a difference of 0.78%).
| Demographics | Rating | Rank | Seniors Poverty Over the Age of 75 |
| Apache | 0.0 /100 | #293 | Tragic 15.3% |
| Immigrants | Jamaica | 0.0 /100 | #294 | Tragic 15.3% |
| U.S. Virgin Islanders | 0.0 /100 | #295 | Tragic 15.4% |
| Yuman | 0.0 /100 | #296 | Tragic 15.4% |
| Hondurans | 0.0 /100 | #297 | Tragic 15.4% |
| Natives/Alaskans | 0.0 /100 | #298 | Tragic 15.5% |
| Spanish American Indians | 0.0 /100 | #299 | Tragic 15.5% |
| Bahamians | 0.0 /100 | #300 | Tragic 15.5% |
| Immigrants | Latin America | 0.0 /100 | #301 | Tragic 15.6% |
| West Indians | 0.0 /100 | #302 | Tragic 15.7% |
| Immigrants | Honduras | 0.0 /100 | #303 | Tragic 15.7% |
| Immigrants | Trinidad and Tobago | 0.0 /100 | #304 | Tragic 15.7% |
| Ecuadorians | 0.0 /100 | #305 | Tragic 15.7% |
| Hispanics or Latinos | 0.0 /100 | #306 | Tragic 15.8% |
| Immigrants | West Indies | 0.0 /100 | #307 | Tragic 15.8% |
Demographics Similar to Immigrants from Zimbabwe by Seniors Poverty Over the Age of 75
In terms of seniors poverty over the age of 75, the demographic groups most similar to Immigrants from Zimbabwe are Icelander (11.7%, a difference of 0.030%), Immigrants from Uganda (11.8%, a difference of 0.13%), New Zealander (11.7%, a difference of 0.14%), Iraqi (11.7%, a difference of 0.14%), and Immigrants from Nepal (11.8%, a difference of 0.16%).
| Demographics | Rating | Rank | Seniors Poverty Over the Age of 75 |
| Burmese | 88.7 /100 | #111 | Excellent 11.7% |
| Immigrants | Bolivia | 88.4 /100 | #112 | Excellent 11.7% |
| Immigrants | Czechoslovakia | 87.0 /100 | #113 | Excellent 11.7% |
| Ukrainians | 86.9 /100 | #114 | Excellent 11.7% |
| New Zealanders | 86.3 /100 | #115 | Excellent 11.7% |
| Iraqis | 86.3 /100 | #116 | Excellent 11.7% |
| Icelanders | 85.7 /100 | #117 | Excellent 11.7% |
| Immigrants | Zimbabwe | 85.5 /100 | #118 | Excellent 11.7% |
| Immigrants | Uganda | 84.8 /100 | #119 | Excellent 11.8% |
| Immigrants | Nepal | 84.5 /100 | #120 | Excellent 11.8% |
| Malaysians | 84.1 /100 | #121 | Excellent 11.8% |
| Pakistanis | 84.0 /100 | #122 | Excellent 11.8% |
| Immigrants | Italy | 84.0 /100 | #123 | Excellent 11.8% |
| Fijians | 83.8 /100 | #124 | Excellent 11.8% |
| Sudanese | 83.6 /100 | #125 | Excellent 11.8% |