Bahamian vs Austrian Median Household Income
COMPARE
Bahamian
Austrian
Median Household Income
Median Household Income Comparison
Bahamians
Austrians
$69,726
MEDIAN HOUSEHOLD INCOME
0.0/ 100
METRIC RATING
323rd/ 347
METRIC RANK
$91,339
MEDIAN HOUSEHOLD INCOME
98.2/ 100
METRIC RATING
102nd/ 347
METRIC RANK
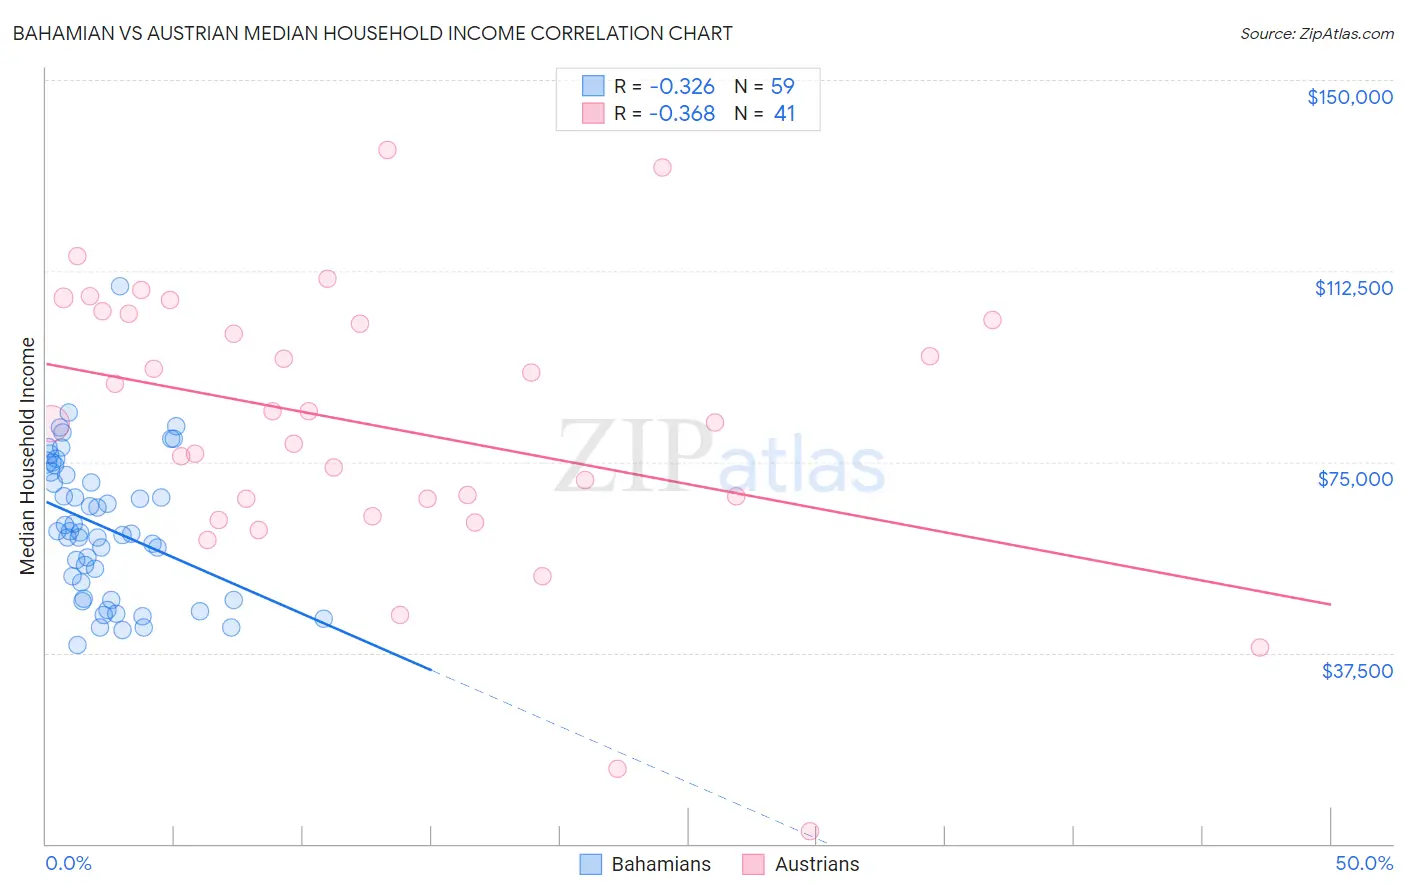
Bahamian vs Austrian Median Household Income Correlation Chart
The statistical analysis conducted on geographies consisting of 112,607,468 people shows a mild negative correlation between the proportion of Bahamians and median household income in the United States with a correlation coefficient (R) of -0.326 and weighted average of $69,726. Similarly, the statistical analysis conducted on geographies consisting of 451,682,607 people shows a mild negative correlation between the proportion of Austrians and median household income in the United States with a correlation coefficient (R) of -0.368 and weighted average of $91,339, a difference of 31.0%.
Median Household Income Correlation Summary
| Measurement | Bahamian | Austrian |
| Minimum | $38,952 | $2,499 |
| Maximum | $109,393 | $136,149 |
| Range | $70,441 | $133,650 |
| Mean | $62,193 | $81,843 |
| Median | $61,085 | $82,650 |
| Interquartile 25% (IQ1) | $48,214 | $65,934 |
| Interquartile 75% (IQ3) | $73,042 | $103,488 |
| Interquartile Range (IQR) | $24,828 | $37,555 |
| Standard Deviation (Sample) | $14,104 | $27,786 |
| Standard Deviation (Population) | $13,984 | $27,445 |
Similar Demographics by Median Household Income
Demographics Similar to Bahamians by Median Household Income
In terms of median household income, the demographic groups most similar to Bahamians are Yup'ik ($69,695, a difference of 0.040%), Choctaw ($69,947, a difference of 0.32%), Chickasaw ($70,005, a difference of 0.40%), Seminole ($69,420, a difference of 0.44%), and Colville ($70,094, a difference of 0.53%).
| Demographics | Rating | Rank | Median Household Income |
| Apache | 0.0 /100 | #316 | Tragic $70,927 |
| Cajuns | 0.0 /100 | #317 | Tragic $70,605 |
| Chippewa | 0.0 /100 | #318 | Tragic $70,539 |
| Immigrants | Dominican Republic | 0.0 /100 | #319 | Tragic $70,208 |
| Colville | 0.0 /100 | #320 | Tragic $70,094 |
| Chickasaw | 0.0 /100 | #321 | Tragic $70,005 |
| Choctaw | 0.0 /100 | #322 | Tragic $69,947 |
| Bahamians | 0.0 /100 | #323 | Tragic $69,726 |
| Yup'ik | 0.0 /100 | #324 | Tragic $69,695 |
| Seminole | 0.0 /100 | #325 | Tragic $69,420 |
| Yuman | 0.0 /100 | #326 | Tragic $68,743 |
| Immigrants | Cuba | 0.0 /100 | #327 | Tragic $68,461 |
| Menominee | 0.0 /100 | #328 | Tragic $68,423 |
| Dutch West Indians | 0.0 /100 | #329 | Tragic $68,412 |
| Arapaho | 0.0 /100 | #330 | Tragic $67,965 |
Demographics Similar to Austrians by Median Household Income
In terms of median household income, the demographic groups most similar to Austrians are Immigrants from Moldova ($91,446, a difference of 0.12%), Ukrainian ($91,456, a difference of 0.13%), Immigrants from South Eastern Asia ($91,541, a difference of 0.22%), Immigrants from Ukraine ($91,124, a difference of 0.24%), and Immigrants from Southern Europe ($91,605, a difference of 0.29%).
| Demographics | Rating | Rank | Median Household Income |
| Armenians | 98.7 /100 | #95 | Exceptional $91,807 |
| Jordanians | 98.7 /100 | #96 | Exceptional $91,794 |
| Immigrants | Serbia | 98.6 /100 | #97 | Exceptional $91,730 |
| Immigrants | Southern Europe | 98.5 /100 | #98 | Exceptional $91,605 |
| Immigrants | South Eastern Asia | 98.4 /100 | #99 | Exceptional $91,541 |
| Ukrainians | 98.3 /100 | #100 | Exceptional $91,456 |
| Immigrants | Moldova | 98.3 /100 | #101 | Exceptional $91,446 |
| Austrians | 98.2 /100 | #102 | Exceptional $91,339 |
| Immigrants | Ukraine | 98.0 /100 | #103 | Exceptional $91,124 |
| Immigrants | Kazakhstan | 97.8 /100 | #104 | Exceptional $91,015 |
| Immigrants | Brazil | 97.7 /100 | #105 | Exceptional $90,907 |
| Macedonians | 97.4 /100 | #106 | Exceptional $90,761 |
| Croatians | 97.3 /100 | #107 | Exceptional $90,685 |
| Zimbabweans | 97.2 /100 | #108 | Exceptional $90,618 |
| Chileans | 97.2 /100 | #109 | Exceptional $90,605 |