Bahamian vs Immigrants from Norway Median Household Income
COMPARE
Bahamian
Immigrants from Norway
Median Household Income
Median Household Income Comparison
Bahamians
Immigrants from Norway
$69,726
MEDIAN HOUSEHOLD INCOME
0.0/ 100
METRIC RATING
323rd/ 347
METRIC RANK
$94,846
MEDIAN HOUSEHOLD INCOME
99.8/ 100
METRIC RATING
62nd/ 347
METRIC RANK
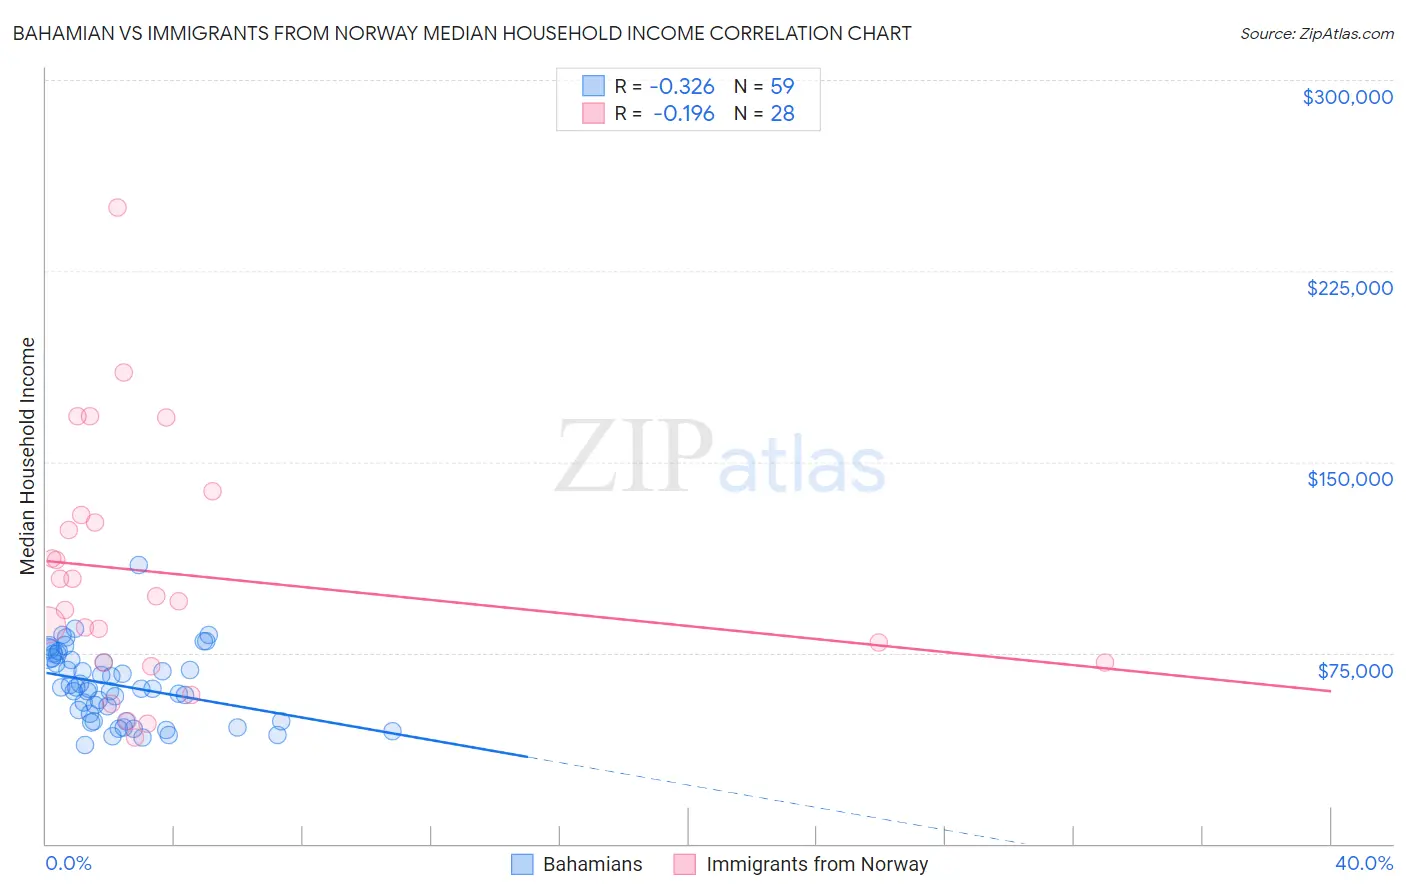
Bahamian vs Immigrants from Norway Median Household Income Correlation Chart
The statistical analysis conducted on geographies consisting of 112,607,468 people shows a mild negative correlation between the proportion of Bahamians and median household income in the United States with a correlation coefficient (R) of -0.326 and weighted average of $69,726. Similarly, the statistical analysis conducted on geographies consisting of 116,683,199 people shows a poor negative correlation between the proportion of Immigrants from Norway and median household income in the United States with a correlation coefficient (R) of -0.196 and weighted average of $94,846, a difference of 36.0%.
Median Household Income Correlation Summary
| Measurement | Bahamian | Immigrants from Norway |
| Minimum | $38,952 | $41,875 |
| Maximum | $109,393 | $250,001 |
| Range | $70,441 | $208,126 |
| Mean | $62,193 | $106,024 |
| Median | $61,085 | $96,218 |
| Interquartile 25% (IQ1) | $48,214 | $71,155 |
| Interquartile 75% (IQ3) | $73,042 | $127,785 |
| Interquartile Range (IQR) | $24,828 | $56,630 |
| Standard Deviation (Sample) | $14,104 | $48,243 |
| Standard Deviation (Population) | $13,984 | $47,374 |
Similar Demographics by Median Household Income
Demographics Similar to Bahamians by Median Household Income
In terms of median household income, the demographic groups most similar to Bahamians are Yup'ik ($69,695, a difference of 0.040%), Choctaw ($69,947, a difference of 0.32%), Chickasaw ($70,005, a difference of 0.40%), Seminole ($69,420, a difference of 0.44%), and Colville ($70,094, a difference of 0.53%).
| Demographics | Rating | Rank | Median Household Income |
| Apache | 0.0 /100 | #316 | Tragic $70,927 |
| Cajuns | 0.0 /100 | #317 | Tragic $70,605 |
| Chippewa | 0.0 /100 | #318 | Tragic $70,539 |
| Immigrants | Dominican Republic | 0.0 /100 | #319 | Tragic $70,208 |
| Colville | 0.0 /100 | #320 | Tragic $70,094 |
| Chickasaw | 0.0 /100 | #321 | Tragic $70,005 |
| Choctaw | 0.0 /100 | #322 | Tragic $69,947 |
| Bahamians | 0.0 /100 | #323 | Tragic $69,726 |
| Yup'ik | 0.0 /100 | #324 | Tragic $69,695 |
| Seminole | 0.0 /100 | #325 | Tragic $69,420 |
| Yuman | 0.0 /100 | #326 | Tragic $68,743 |
| Immigrants | Cuba | 0.0 /100 | #327 | Tragic $68,461 |
| Menominee | 0.0 /100 | #328 | Tragic $68,423 |
| Dutch West Indians | 0.0 /100 | #329 | Tragic $68,412 |
| Arapaho | 0.0 /100 | #330 | Tragic $67,965 |
Demographics Similar to Immigrants from Norway by Median Household Income
In terms of median household income, the demographic groups most similar to Immigrants from Norway are Greek ($94,735, a difference of 0.12%), Laotian ($94,990, a difference of 0.15%), Korean ($95,018, a difference of 0.18%), Immigrants from Europe ($95,032, a difference of 0.20%), and Soviet Union ($95,098, a difference of 0.27%).
| Demographics | Rating | Rank | Median Household Income |
| Immigrants | Czechoslovakia | 99.9 /100 | #55 | Exceptional $95,319 |
| Immigrants | Austria | 99.9 /100 | #56 | Exceptional $95,277 |
| New Zealanders | 99.8 /100 | #57 | Exceptional $95,146 |
| Soviet Union | 99.8 /100 | #58 | Exceptional $95,098 |
| Immigrants | Europe | 99.8 /100 | #59 | Exceptional $95,032 |
| Koreans | 99.8 /100 | #60 | Exceptional $95,018 |
| Laotians | 99.8 /100 | #61 | Exceptional $94,990 |
| Immigrants | Norway | 99.8 /100 | #62 | Exceptional $94,846 |
| Greeks | 99.8 /100 | #63 | Exceptional $94,735 |
| Immigrants | Netherlands | 99.7 /100 | #64 | Exceptional $94,411 |
| Immigrants | Belarus | 99.7 /100 | #65 | Exceptional $94,399 |
| Immigrants | Romania | 99.7 /100 | #66 | Exceptional $94,222 |
| Immigrants | Scotland | 99.7 /100 | #67 | Exceptional $94,091 |
| Mongolians | 99.7 /100 | #68 | Exceptional $93,971 |
| Argentineans | 99.7 /100 | #69 | Exceptional $93,960 |