Czechoslovakian vs Immigrants from Fiji Median Male Earnings
COMPARE
Czechoslovakian
Immigrants from Fiji
Median Male Earnings
Median Male Earnings Comparison
Czechoslovakians
Immigrants from Fiji
$55,382
MEDIAN MALE EARNINGS
70.5/ 100
METRIC RATING
158th/ 347
METRIC RANK
$54,958
MEDIAN MALE EARNINGS
61.2/ 100
METRIC RATING
167th/ 347
METRIC RANK
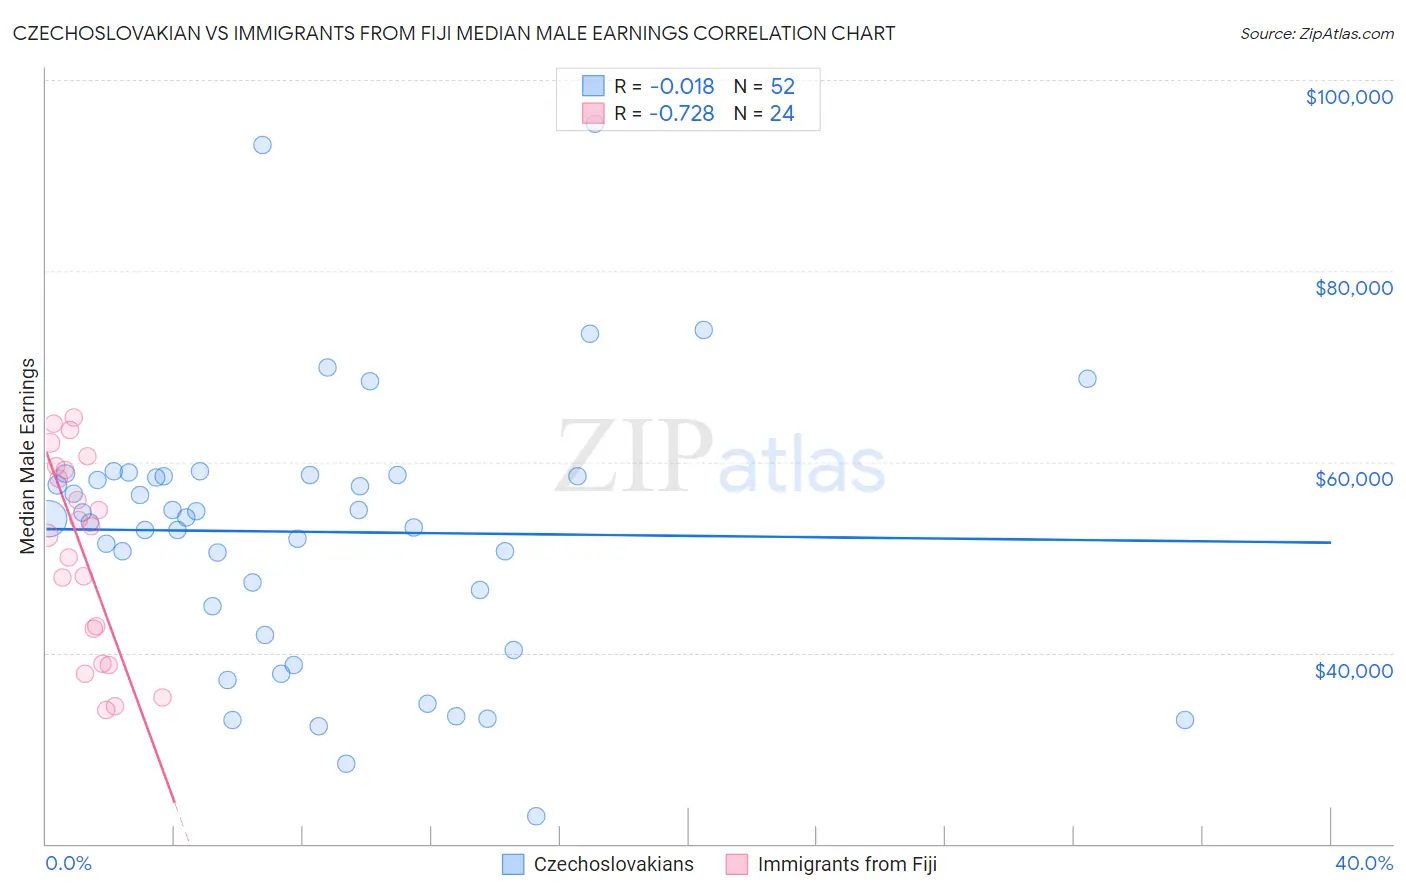
Czechoslovakian vs Immigrants from Fiji Median Male Earnings Correlation Chart
The statistical analysis conducted on geographies consisting of 368,529,148 people shows no correlation between the proportion of Czechoslovakians and median male earnings in the United States with a correlation coefficient (R) of -0.018 and weighted average of $55,382. Similarly, the statistical analysis conducted on geographies consisting of 93,749,619 people shows a strong negative correlation between the proportion of Immigrants from Fiji and median male earnings in the United States with a correlation coefficient (R) of -0.728 and weighted average of $54,958, a difference of 0.77%.
Median Male Earnings Correlation Summary
| Measurement | Czechoslovakian | Immigrants from Fiji |
| Minimum | $22,917 | $34,054 |
| Maximum | $95,417 | $64,713 |
| Range | $72,500 | $30,659 |
| Mean | $52,664 | $50,520 |
| Median | $54,109 | $52,738 |
| Interquartile 25% (IQ1) | $43,411 | $40,707 |
| Interquartile 75% (IQ3) | $58,532 | $59,322 |
| Interquartile Range (IQR) | $15,121 | $18,615 |
| Standard Deviation (Sample) | $14,290 | $10,211 |
| Standard Deviation (Population) | $14,152 | $9,996 |
Demographics Similar to Czechoslovakians and Immigrants from Fiji by Median Male Earnings
In terms of median male earnings, the demographic groups most similar to Czechoslovakians are Alsatian ($55,380, a difference of 0.0%), Basque ($55,370, a difference of 0.020%), Belgian ($55,361, a difference of 0.040%), Icelander ($55,415, a difference of 0.060%), and French ($55,350, a difference of 0.060%). Similarly, the demographic groups most similar to Immigrants from Fiji are German ($54,974, a difference of 0.030%), Immigrants from Vietnam ($54,913, a difference of 0.080%), Immigrants from Portugal ($55,182, a difference of 0.41%), French Canadian ($54,722, a difference of 0.43%), and Finnish ($54,721, a difference of 0.43%).
| Demographics | Rating | Rank | Median Male Earnings |
| Peruvians | 75.8 /100 | #152 | Good $55,659 |
| Immigrants | Nepal | 75.0 /100 | #153 | Good $55,615 |
| Taiwanese | 73.9 /100 | #154 | Good $55,556 |
| Scandinavians | 73.4 /100 | #155 | Good $55,527 |
| Immigrants | Ethiopia | 71.6 /100 | #156 | Good $55,434 |
| Icelanders | 71.2 /100 | #157 | Good $55,415 |
| Czechoslovakians | 70.5 /100 | #158 | Good $55,382 |
| Alsatians | 70.5 /100 | #159 | Good $55,380 |
| Basques | 70.3 /100 | #160 | Good $55,370 |
| Belgians | 70.1 /100 | #161 | Good $55,361 |
| French | 69.9 /100 | #162 | Good $55,350 |
| Ugandans | 68.6 /100 | #163 | Good $55,290 |
| Immigrants | South Eastern Asia | 67.6 /100 | #164 | Good $55,241 |
| Immigrants | Portugal | 66.3 /100 | #165 | Good $55,182 |
| Germans | 61.6 /100 | #166 | Good $54,974 |
| Immigrants | Fiji | 61.2 /100 | #167 | Good $54,958 |
| Immigrants | Vietnam | 60.2 /100 | #168 | Good $54,913 |
| French Canadians | 55.6 /100 | #169 | Average $54,722 |
| Finns | 55.6 /100 | #170 | Average $54,721 |
| Immigrants | Peru | 54.9 /100 | #171 | Average $54,695 |
| Welsh | 53.8 /100 | #172 | Average $54,647 |