Iroquois vs Dutch Median Male Earnings
COMPARE
Iroquois
Dutch
Median Male Earnings
Median Male Earnings Comparison
Iroquois
Dutch
$49,374
MEDIAN MALE EARNINGS
0.7/ 100
METRIC RATING
260th/ 347
METRIC RANK
$54,410
MEDIAN MALE EARNINGS
48.0/ 100
METRIC RATING
175th/ 347
METRIC RANK
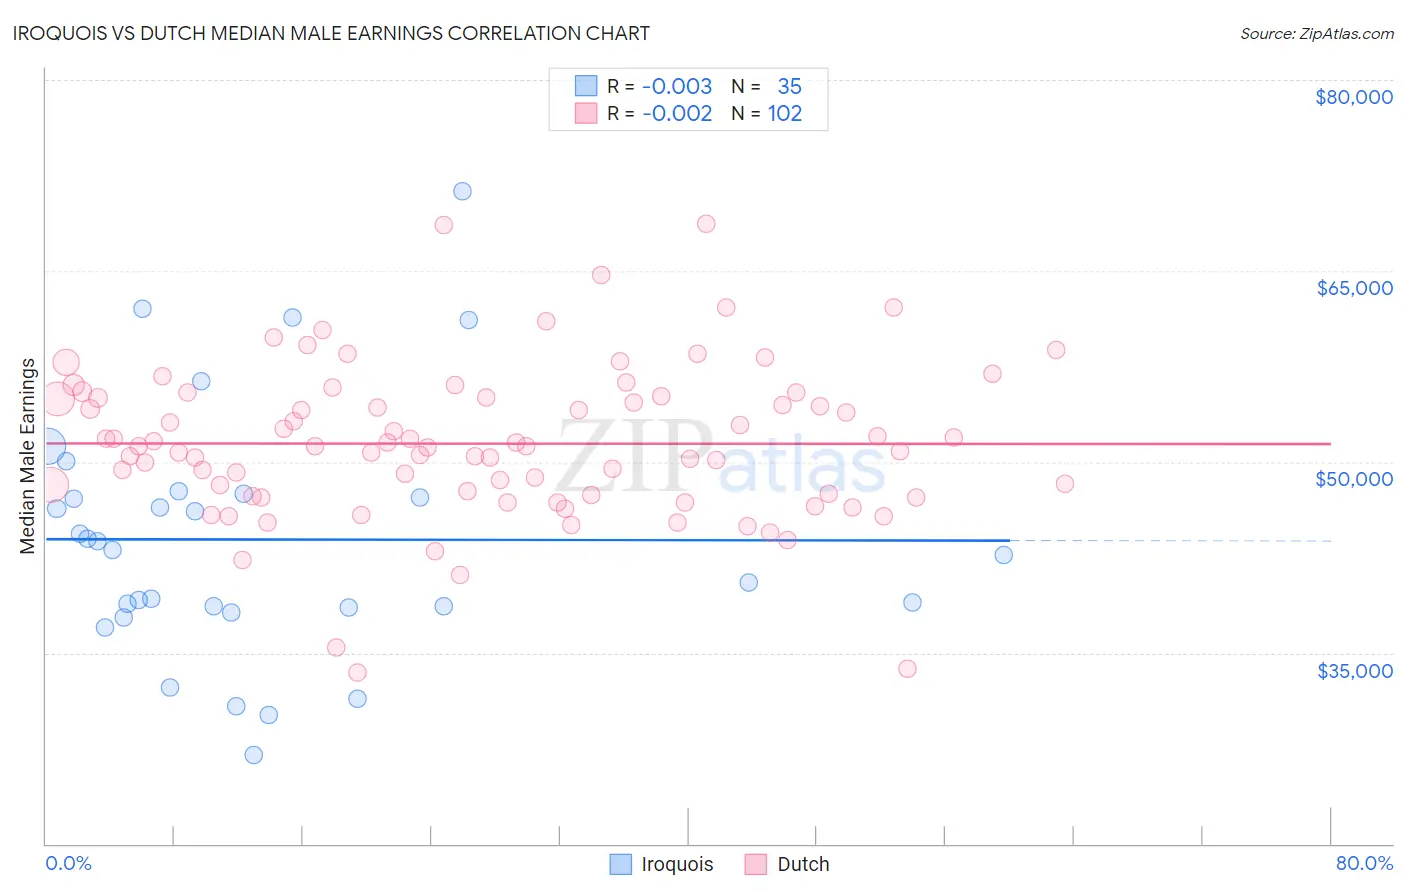
Iroquois vs Dutch Median Male Earnings Correlation Chart
The statistical analysis conducted on geographies consisting of 207,261,653 people shows no correlation between the proportion of Iroquois and median male earnings in the United States with a correlation coefficient (R) of -0.003 and weighted average of $49,374. Similarly, the statistical analysis conducted on geographies consisting of 553,393,301 people shows no correlation between the proportion of Dutch and median male earnings in the United States with a correlation coefficient (R) of -0.002 and weighted average of $54,410, a difference of 10.2%.
Median Male Earnings Correlation Summary
| Measurement | Iroquois | Dutch |
| Minimum | $26,985 | $33,485 |
| Maximum | $71,281 | $68,738 |
| Range | $44,296 | $35,252 |
| Mean | $43,903 | $51,429 |
| Median | $43,033 | $51,206 |
| Interquartile 25% (IQ1) | $38,514 | $47,383 |
| Interquartile 75% (IQ3) | $47,481 | $55,055 |
| Interquartile Range (IQR) | $8,967 | $7,672 |
| Standard Deviation (Sample) | $9,773 | $6,107 |
| Standard Deviation (Population) | $9,632 | $6,077 |
Similar Demographics by Median Male Earnings
Demographics Similar to Iroquois by Median Male Earnings
In terms of median male earnings, the demographic groups most similar to Iroquois are Liberian ($49,318, a difference of 0.11%), Nepalese ($49,458, a difference of 0.17%), Immigrants from West Indies ($49,271, a difference of 0.21%), Cree ($49,497, a difference of 0.25%), and Nicaraguan ($49,215, a difference of 0.32%).
| Demographics | Rating | Rank | Median Male Earnings |
| German Russians | 1.1 /100 | #253 | Tragic $49,924 |
| Senegalese | 1.0 /100 | #254 | Tragic $49,774 |
| Alaskan Athabascans | 0.9 /100 | #255 | Tragic $49,748 |
| Alaska Natives | 0.9 /100 | #256 | Tragic $49,711 |
| British West Indians | 0.8 /100 | #257 | Tragic $49,636 |
| Cree | 0.7 /100 | #258 | Tragic $49,497 |
| Nepalese | 0.7 /100 | #259 | Tragic $49,458 |
| Iroquois | 0.7 /100 | #260 | Tragic $49,374 |
| Liberians | 0.6 /100 | #261 | Tragic $49,318 |
| Immigrants | West Indies | 0.6 /100 | #262 | Tragic $49,271 |
| Nicaraguans | 0.6 /100 | #263 | Tragic $49,215 |
| Immigrants | Middle Africa | 0.6 /100 | #264 | Tragic $49,201 |
| Immigrants | Laos | 0.6 /100 | #265 | Tragic $49,190 |
| Somalis | 0.5 /100 | #266 | Tragic $49,025 |
| Spanish Americans | 0.5 /100 | #267 | Tragic $49,008 |
Demographics Similar to Dutch by Median Male Earnings
In terms of median male earnings, the demographic groups most similar to Dutch are Spaniard ($54,401, a difference of 0.020%), South American ($54,492, a difference of 0.15%), South American Indian ($54,508, a difference of 0.18%), Costa Rican ($54,279, a difference of 0.24%), and Sierra Leonean ($54,279, a difference of 0.24%).
| Demographics | Rating | Rank | Median Male Earnings |
| Immigrants | Vietnam | 60.2 /100 | #168 | Good $54,913 |
| French Canadians | 55.6 /100 | #169 | Average $54,722 |
| Finns | 55.6 /100 | #170 | Average $54,721 |
| Immigrants | Peru | 54.9 /100 | #171 | Average $54,695 |
| Welsh | 53.8 /100 | #172 | Average $54,647 |
| South American Indians | 50.4 /100 | #173 | Average $54,508 |
| South Americans | 50.0 /100 | #174 | Average $54,492 |
| Dutch | 48.0 /100 | #175 | Average $54,410 |
| Spaniards | 47.8 /100 | #176 | Average $54,401 |
| Costa Ricans | 44.8 /100 | #177 | Average $54,279 |
| Sierra Leoneans | 44.8 /100 | #178 | Average $54,279 |
| Celtics | 43.9 /100 | #179 | Average $54,242 |
| Iraqis | 42.5 /100 | #180 | Average $54,182 |
| Immigrants | Immigrants | 42.1 /100 | #181 | Average $54,168 |
| Yugoslavians | 37.4 /100 | #182 | Fair $53,967 |