Maltese vs Dutch Median Male Earnings
COMPARE
Maltese
Dutch
Median Male Earnings
Median Male Earnings Comparison
Maltese
Dutch
$62,953
MEDIAN MALE EARNINGS
100.0/ 100
METRIC RATING
38th/ 347
METRIC RANK
$54,410
MEDIAN MALE EARNINGS
48.0/ 100
METRIC RATING
175th/ 347
METRIC RANK
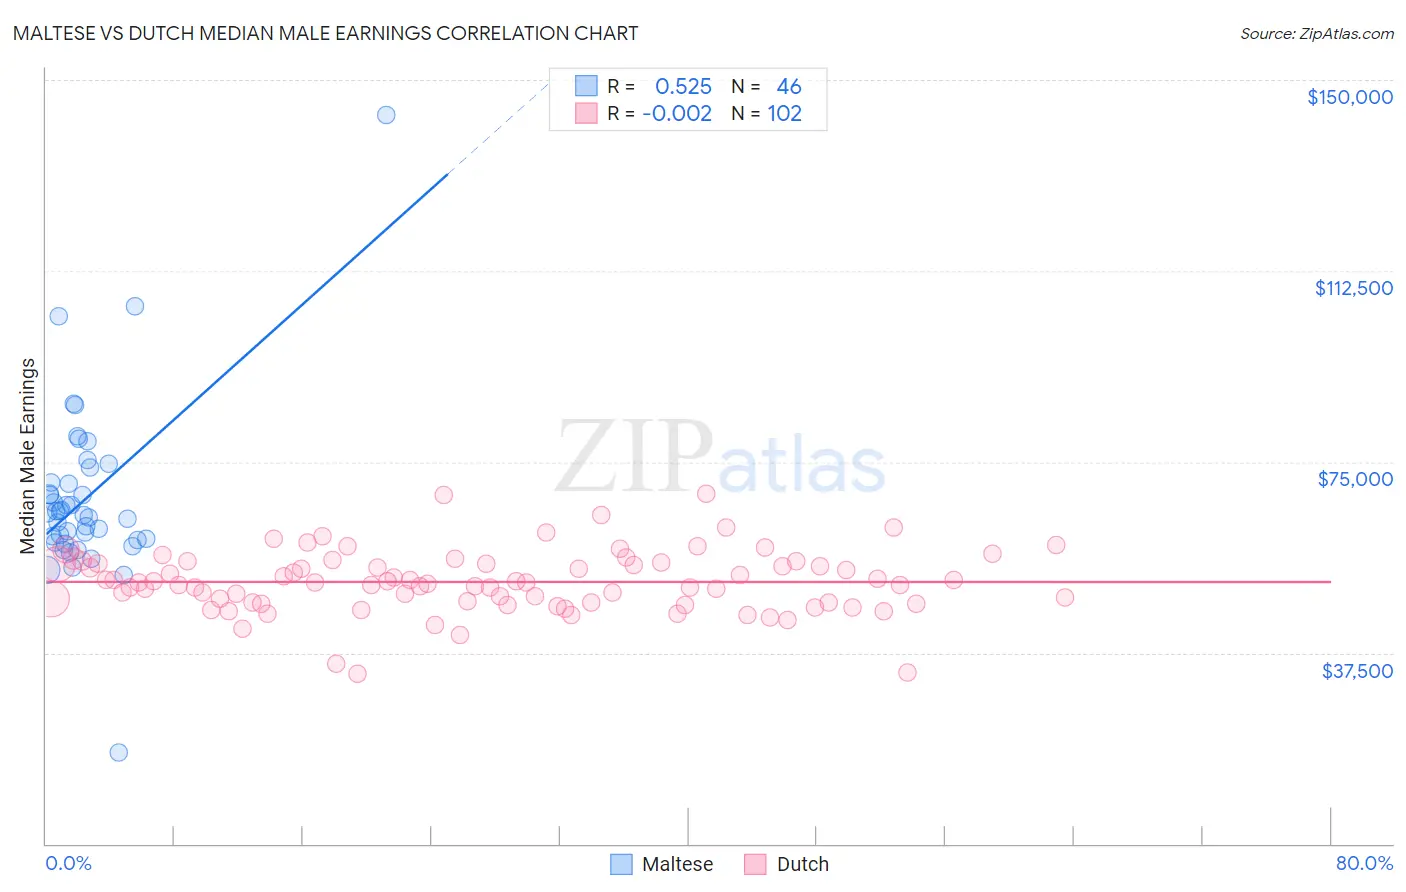
Maltese vs Dutch Median Male Earnings Correlation Chart
The statistical analysis conducted on geographies consisting of 126,470,445 people shows a substantial positive correlation between the proportion of Maltese and median male earnings in the United States with a correlation coefficient (R) of 0.525 and weighted average of $62,953. Similarly, the statistical analysis conducted on geographies consisting of 553,393,301 people shows no correlation between the proportion of Dutch and median male earnings in the United States with a correlation coefficient (R) of -0.002 and weighted average of $54,410, a difference of 15.7%.
Median Male Earnings Correlation Summary
| Measurement | Maltese | Dutch |
| Minimum | $17,917 | $33,485 |
| Maximum | $143,125 | $68,738 |
| Range | $125,208 | $35,252 |
| Mean | $67,890 | $51,429 |
| Median | $64,879 | $51,206 |
| Interquartile 25% (IQ1) | $59,600 | $47,383 |
| Interquartile 75% (IQ3) | $71,008 | $55,055 |
| Interquartile Range (IQR) | $11,408 | $7,672 |
| Standard Deviation (Sample) | $17,590 | $6,107 |
| Standard Deviation (Population) | $17,397 | $6,077 |
Similar Demographics by Median Male Earnings
Demographics Similar to Maltese by Median Male Earnings
In terms of median male earnings, the demographic groups most similar to Maltese are Immigrants from South Africa ($62,899, a difference of 0.090%), Australian ($62,857, a difference of 0.15%), Immigrants from Sri Lanka ($63,099, a difference of 0.23%), Immigrants from Turkey ($62,728, a difference of 0.36%), and Immigrants from Greece ($62,689, a difference of 0.42%).
| Demographics | Rating | Rank | Median Male Earnings |
| Latvians | 100.0 /100 | #31 | Exceptional $63,498 |
| Soviet Union | 100.0 /100 | #32 | Exceptional $63,382 |
| Immigrants | Lithuania | 100.0 /100 | #33 | Exceptional $63,346 |
| Immigrants | Russia | 100.0 /100 | #34 | Exceptional $63,326 |
| Immigrants | Asia | 100.0 /100 | #35 | Exceptional $63,240 |
| Israelis | 100.0 /100 | #36 | Exceptional $63,228 |
| Immigrants | Sri Lanka | 100.0 /100 | #37 | Exceptional $63,099 |
| Maltese | 100.0 /100 | #38 | Exceptional $62,953 |
| Immigrants | South Africa | 100.0 /100 | #39 | Exceptional $62,899 |
| Australians | 100.0 /100 | #40 | Exceptional $62,857 |
| Immigrants | Turkey | 100.0 /100 | #41 | Exceptional $62,728 |
| Immigrants | Greece | 100.0 /100 | #42 | Exceptional $62,689 |
| Immigrants | Belarus | 100.0 /100 | #43 | Exceptional $62,658 |
| Cambodians | 100.0 /100 | #44 | Exceptional $62,516 |
| Bulgarians | 100.0 /100 | #45 | Exceptional $62,378 |
Demographics Similar to Dutch by Median Male Earnings
In terms of median male earnings, the demographic groups most similar to Dutch are Spaniard ($54,401, a difference of 0.020%), South American ($54,492, a difference of 0.15%), South American Indian ($54,508, a difference of 0.18%), Costa Rican ($54,279, a difference of 0.24%), and Sierra Leonean ($54,279, a difference of 0.24%).
| Demographics | Rating | Rank | Median Male Earnings |
| Immigrants | Vietnam | 60.2 /100 | #168 | Good $54,913 |
| French Canadians | 55.6 /100 | #169 | Average $54,722 |
| Finns | 55.6 /100 | #170 | Average $54,721 |
| Immigrants | Peru | 54.9 /100 | #171 | Average $54,695 |
| Welsh | 53.8 /100 | #172 | Average $54,647 |
| South American Indians | 50.4 /100 | #173 | Average $54,508 |
| South Americans | 50.0 /100 | #174 | Average $54,492 |
| Dutch | 48.0 /100 | #175 | Average $54,410 |
| Spaniards | 47.8 /100 | #176 | Average $54,401 |
| Costa Ricans | 44.8 /100 | #177 | Average $54,279 |
| Sierra Leoneans | 44.8 /100 | #178 | Average $54,279 |
| Celtics | 43.9 /100 | #179 | Average $54,242 |
| Iraqis | 42.5 /100 | #180 | Average $54,182 |
| Immigrants | Immigrants | 42.1 /100 | #181 | Average $54,168 |
| Yugoslavians | 37.4 /100 | #182 | Fair $53,967 |