Albanian vs Scottish Householder Income Over 65 years
COMPARE
Albanian
Scottish
Householder Income Over 65 years
Householder Income Over 65 years Comparison
Albanians
Scottish
$60,249
HOUSEHOLDER INCOME OVER 65 YEARS
32.0/ 100
METRIC RATING
185th/ 347
METRIC RANK
$61,735
HOUSEHOLDER INCOME OVER 65 YEARS
69.1/ 100
METRIC RATING
149th/ 347
METRIC RANK
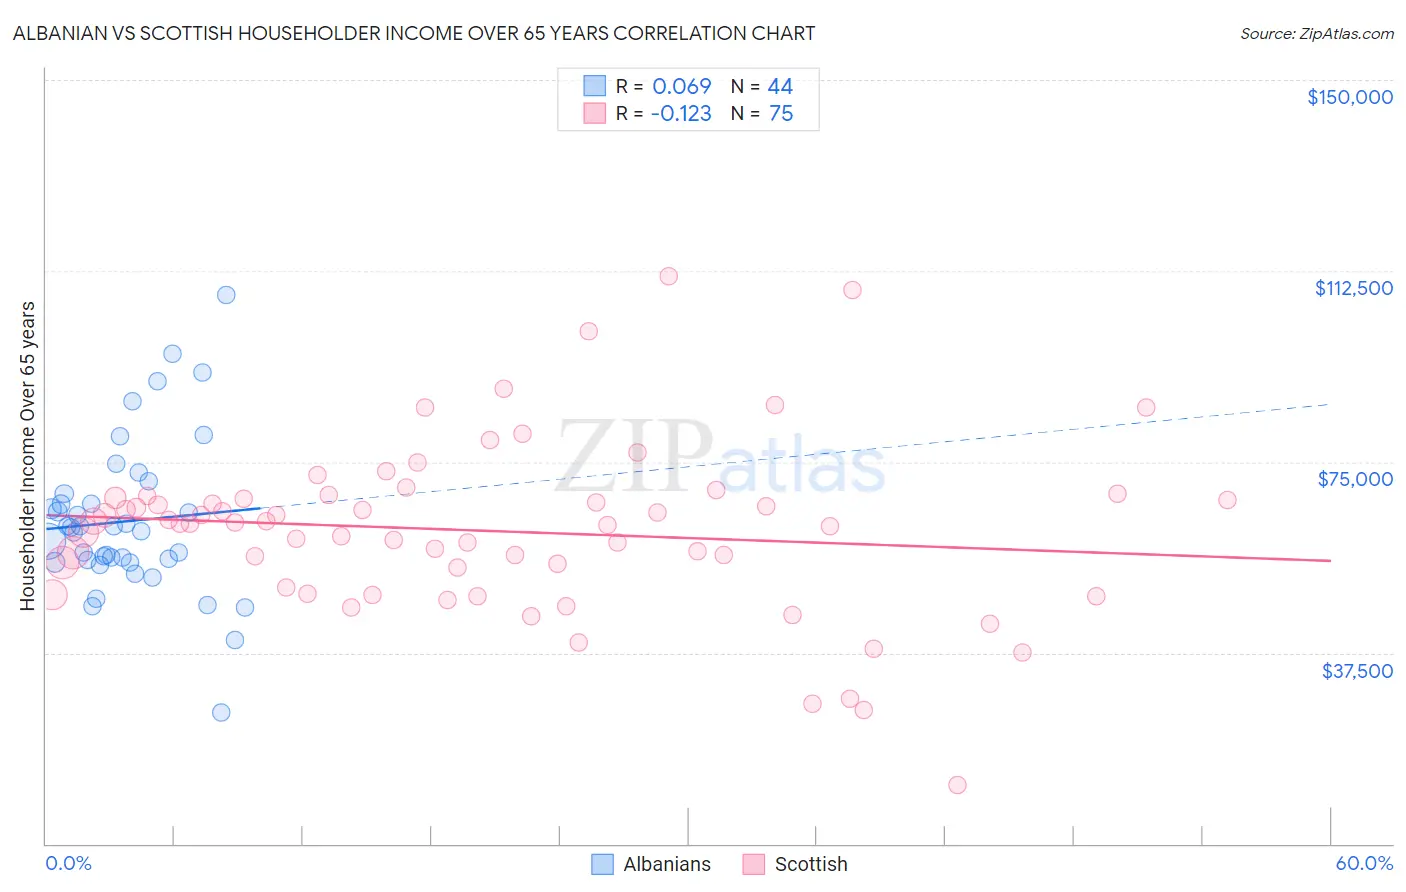
Albanian vs Scottish Householder Income Over 65 years Correlation Chart
The statistical analysis conducted on geographies consisting of 192,894,684 people shows a slight positive correlation between the proportion of Albanians and household income with householder over the age of 65 in the United States with a correlation coefficient (R) of 0.069 and weighted average of $60,249. Similarly, the statistical analysis conducted on geographies consisting of 561,942,660 people shows a poor negative correlation between the proportion of Scottish and household income with householder over the age of 65 in the United States with a correlation coefficient (R) of -0.123 and weighted average of $61,735, a difference of 2.5%.
Householder Income Over 65 years Correlation Summary
| Measurement | Albanian | Scottish |
| Minimum | $25,833 | $11,480 |
| Maximum | $107,661 | $111,394 |
| Range | $81,828 | $99,914 |
| Mean | $63,338 | $61,439 |
| Median | $61,807 | $62,867 |
| Interquartile 25% (IQ1) | $55,515 | $50,429 |
| Interquartile 75% (IQ3) | $67,768 | $67,901 |
| Interquartile Range (IQR) | $12,253 | $17,472 |
| Standard Deviation (Sample) | $15,246 | $16,892 |
| Standard Deviation (Population) | $15,071 | $16,779 |
Similar Demographics by Householder Income Over 65 years
Demographics Similar to Albanians by Householder Income Over 65 years
In terms of householder income over 65 years, the demographic groups most similar to Albanians are Slovene ($60,241, a difference of 0.010%), Immigrants from Thailand ($60,217, a difference of 0.050%), Immigrants from Eritrea ($60,096, a difference of 0.26%), Ghanaian ($60,043, a difference of 0.34%), and Iraqi ($60,466, a difference of 0.36%).
| Demographics | Rating | Rank | Householder Income Over 65 years |
| Yup'ik | 43.7 /100 | #178 | Average $60,727 |
| Welsh | 42.2 /100 | #179 | Average $60,666 |
| Immigrants | Morocco | 41.7 /100 | #180 | Average $60,647 |
| Celtics | 40.7 /100 | #181 | Average $60,608 |
| Czechoslovakians | 40.0 /100 | #182 | Average $60,581 |
| Kenyans | 38.4 /100 | #183 | Fair $60,514 |
| Iraqis | 37.2 /100 | #184 | Fair $60,466 |
| Albanians | 32.0 /100 | #185 | Fair $60,249 |
| Slovenes | 31.8 /100 | #186 | Fair $60,241 |
| Immigrants | Thailand | 31.3 /100 | #187 | Fair $60,217 |
| Immigrants | Eritrea | 28.6 /100 | #188 | Fair $60,096 |
| Ghanaians | 27.5 /100 | #189 | Fair $60,043 |
| Puget Sound Salish | 25.3 /100 | #190 | Fair $59,934 |
| Belgians | 24.9 /100 | #191 | Fair $59,915 |
| South Americans | 23.8 /100 | #192 | Fair $59,854 |
Demographics Similar to Scottish by Householder Income Over 65 years
In terms of householder income over 65 years, the demographic groups most similar to Scottish are Slavic ($61,709, a difference of 0.040%), Alsatian ($61,797, a difference of 0.10%), Hungarian ($61,673, a difference of 0.10%), Armenian ($61,656, a difference of 0.13%), and Costa Rican ($61,638, a difference of 0.16%).
| Demographics | Rating | Rank | Householder Income Over 65 years |
| South American Indians | 78.7 /100 | #142 | Good $62,215 |
| Immigrants | Belarus | 77.8 /100 | #143 | Good $62,162 |
| Immigrants | Peru | 74.4 /100 | #144 | Good $61,988 |
| Immigrants | Uganda | 74.2 /100 | #145 | Good $61,976 |
| Immigrants | Southern Europe | 72.7 /100 | #146 | Good $61,902 |
| Immigrants | Nepal | 71.4 /100 | #147 | Good $61,843 |
| Alsatians | 70.5 /100 | #148 | Good $61,797 |
| Scottish | 69.1 /100 | #149 | Good $61,735 |
| Slavs | 68.5 /100 | #150 | Good $61,709 |
| Hungarians | 67.7 /100 | #151 | Good $61,673 |
| Armenians | 67.3 /100 | #152 | Good $61,656 |
| Costa Ricans | 66.9 /100 | #153 | Good $61,638 |
| Swiss | 66.5 /100 | #154 | Good $61,621 |
| Poles | 65.9 /100 | #155 | Good $61,598 |
| Scandinavians | 65.6 /100 | #156 | Good $61,586 |