Icelander vs Scottish Householder Income Over 65 years
COMPARE
Icelander
Scottish
Householder Income Over 65 years
Householder Income Over 65 years Comparison
Icelanders
Scottish
$61,270
HOUSEHOLDER INCOME OVER 65 YEARS
57.9/ 100
METRIC RATING
161st/ 347
METRIC RANK
$61,735
HOUSEHOLDER INCOME OVER 65 YEARS
69.1/ 100
METRIC RATING
149th/ 347
METRIC RANK
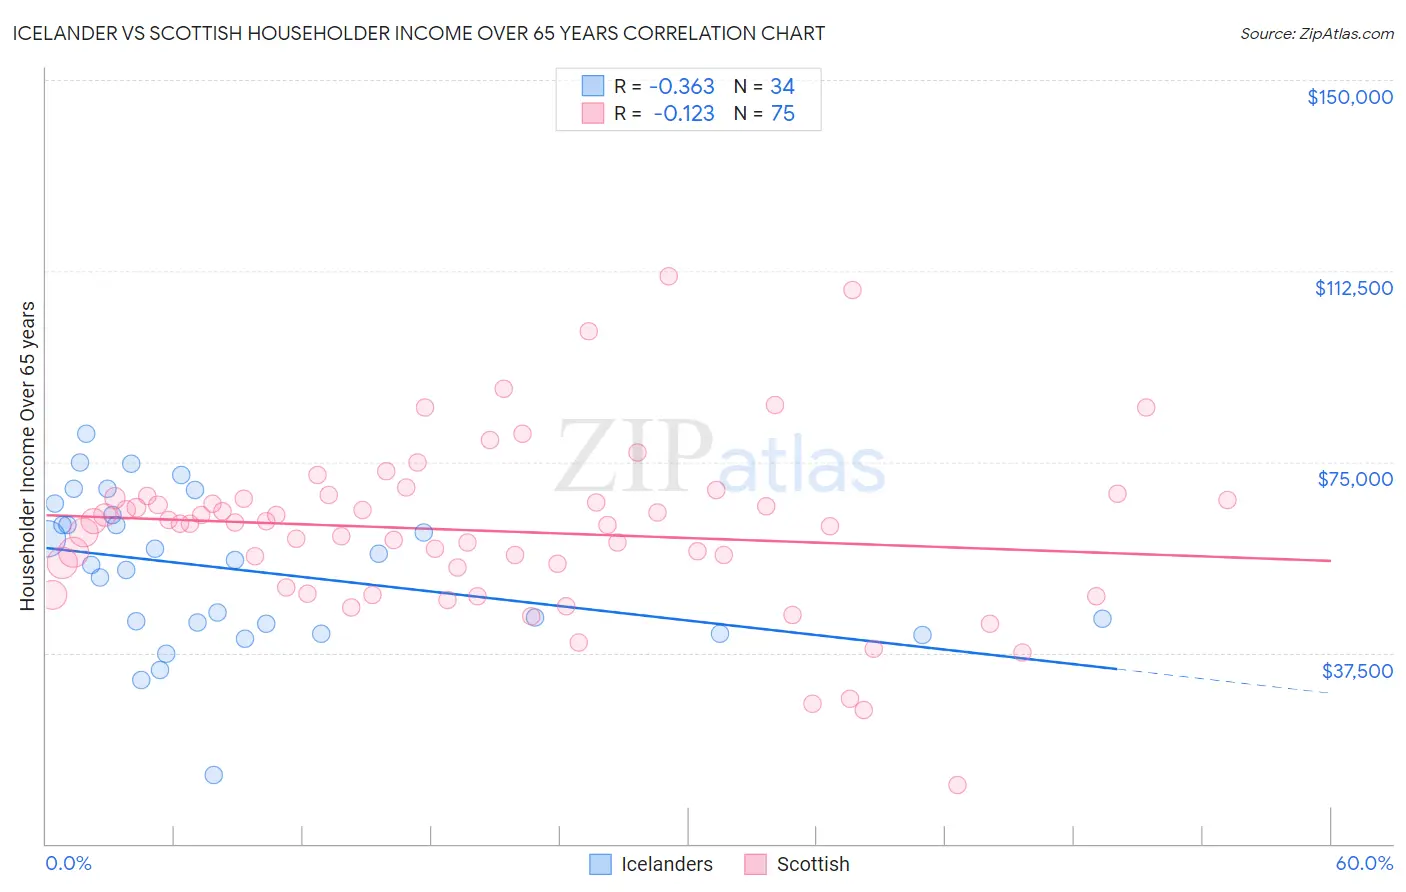
Icelander vs Scottish Householder Income Over 65 years Correlation Chart
The statistical analysis conducted on geographies consisting of 159,443,752 people shows a mild negative correlation between the proportion of Icelanders and household income with householder over the age of 65 in the United States with a correlation coefficient (R) of -0.363 and weighted average of $61,270. Similarly, the statistical analysis conducted on geographies consisting of 561,942,660 people shows a poor negative correlation between the proportion of Scottish and household income with householder over the age of 65 in the United States with a correlation coefficient (R) of -0.123 and weighted average of $61,735, a difference of 0.76%.
Householder Income Over 65 years Correlation Summary
| Measurement | Icelander | Scottish |
| Minimum | $13,621 | $11,480 |
| Maximum | $80,499 | $111,394 |
| Range | $66,878 | $99,914 |
| Mean | $53,773 | $61,439 |
| Median | $55,258 | $62,867 |
| Interquartile 25% (IQ1) | $43,319 | $50,429 |
| Interquartile 75% (IQ3) | $64,676 | $67,901 |
| Interquartile Range (IQR) | $21,357 | $17,472 |
| Standard Deviation (Sample) | $14,894 | $16,892 |
| Standard Deviation (Population) | $14,674 | $16,779 |
Demographics Similar to Icelanders and Scottish by Householder Income Over 65 years
In terms of householder income over 65 years, the demographic groups most similar to Icelanders are Czech ($61,244, a difference of 0.040%), Ugandan ($61,177, a difference of 0.15%), Immigrants from North Macedonia ($61,175, a difference of 0.16%), Immigrants from Ukraine ($61,163, a difference of 0.18%), and Portuguese ($61,440, a difference of 0.28%). Similarly, the demographic groups most similar to Scottish are Slavic ($61,709, a difference of 0.040%), Alsatian ($61,797, a difference of 0.10%), Hungarian ($61,673, a difference of 0.10%), Armenian ($61,656, a difference of 0.13%), and Costa Rican ($61,638, a difference of 0.16%).
| Demographics | Rating | Rank | Householder Income Over 65 years |
| Immigrants | Uganda | 74.2 /100 | #145 | Good $61,976 |
| Immigrants | Southern Europe | 72.7 /100 | #146 | Good $61,902 |
| Immigrants | Nepal | 71.4 /100 | #147 | Good $61,843 |
| Alsatians | 70.5 /100 | #148 | Good $61,797 |
| Scottish | 69.1 /100 | #149 | Good $61,735 |
| Slavs | 68.5 /100 | #150 | Good $61,709 |
| Hungarians | 67.7 /100 | #151 | Good $61,673 |
| Armenians | 67.3 /100 | #152 | Good $61,656 |
| Costa Ricans | 66.9 /100 | #153 | Good $61,638 |
| Swiss | 66.5 /100 | #154 | Good $61,621 |
| Poles | 65.9 /100 | #155 | Good $61,598 |
| Scandinavians | 65.6 /100 | #156 | Good $61,586 |
| Macedonians | 65.1 /100 | #157 | Good $61,564 |
| English | 63.3 /100 | #158 | Good $61,487 |
| Brazilians | 62.7 /100 | #159 | Good $61,465 |
| Portuguese | 62.1 /100 | #160 | Good $61,440 |
| Icelanders | 57.9 /100 | #161 | Average $61,270 |
| Czechs | 57.2 /100 | #162 | Average $61,244 |
| Ugandans | 55.5 /100 | #163 | Average $61,177 |
| Immigrants | North Macedonia | 55.4 /100 | #164 | Average $61,175 |
| Immigrants | Ukraine | 55.1 /100 | #165 | Average $61,163 |