Immigrants from South Eastern Asia vs Haitian Householder Income Under 25 years
COMPARE
Immigrants from South Eastern Asia
Haitian
Householder Income Under 25 years
Householder Income Under 25 years Comparison
Immigrants from South Eastern Asia
Haitians
$55,714
HOUSEHOLDER INCOME UNDER 25 YEARS
100.0/ 100
METRIC RATING
43rd/ 347
METRIC RANK
$50,231
HOUSEHOLDER INCOME UNDER 25 YEARS
0.8/ 100
METRIC RATING
262nd/ 347
METRIC RANK
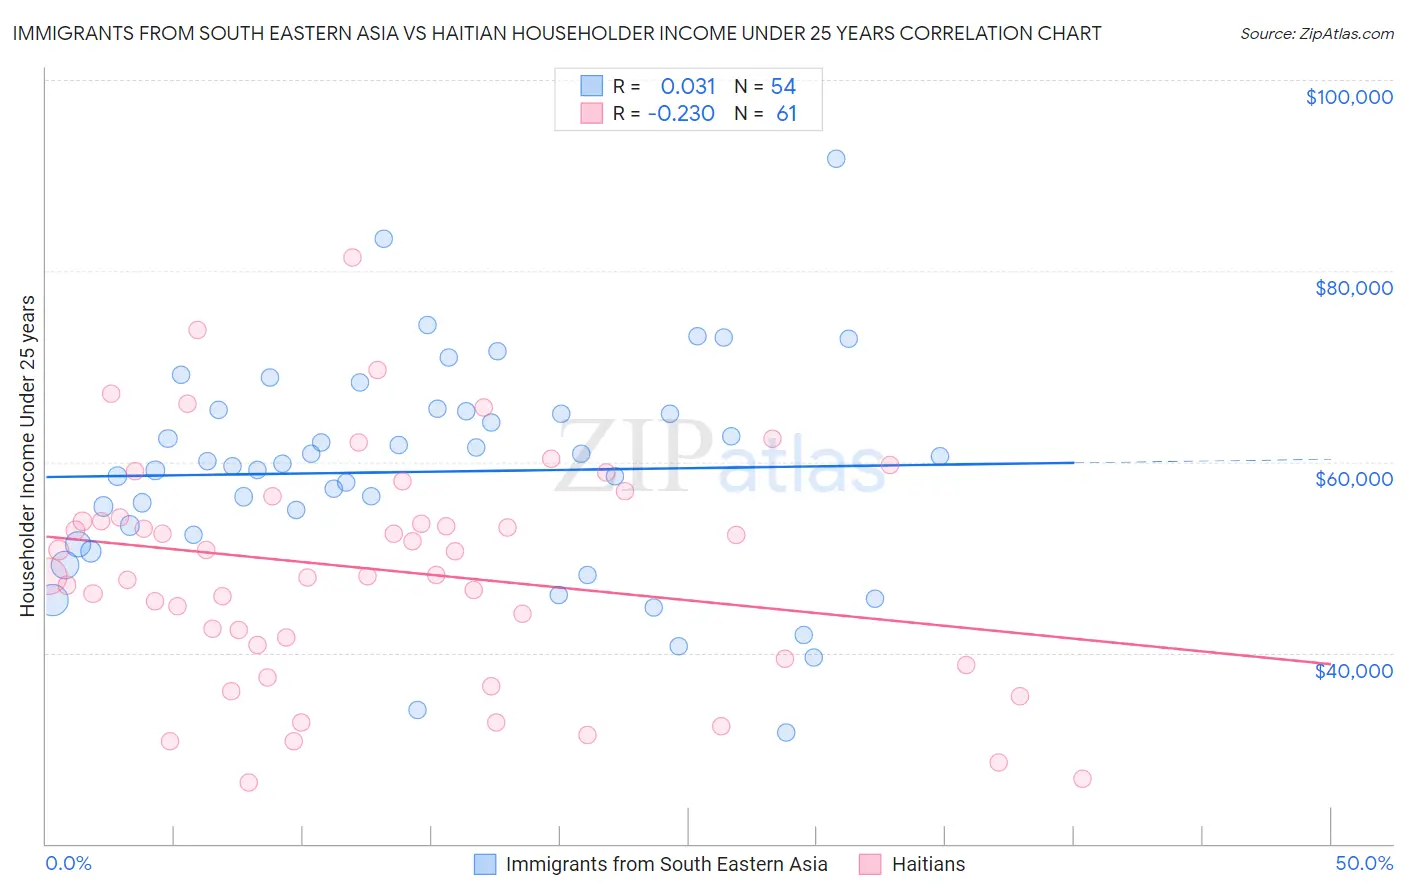
Immigrants from South Eastern Asia vs Haitian Householder Income Under 25 years Correlation Chart
The statistical analysis conducted on geographies consisting of 413,516,048 people shows no correlation between the proportion of Immigrants from South Eastern Asia and household income with householder under the age of 25 in the United States with a correlation coefficient (R) of 0.031 and weighted average of $55,714. Similarly, the statistical analysis conducted on geographies consisting of 247,862,749 people shows a weak negative correlation between the proportion of Haitians and household income with householder under the age of 25 in the United States with a correlation coefficient (R) of -0.230 and weighted average of $50,231, a difference of 10.9%.
Householder Income Under 25 years Correlation Summary
| Measurement | Immigrants from South Eastern Asia | Haitian |
| Minimum | $31,667 | $26,478 |
| Maximum | $91,771 | $81,415 |
| Range | $60,104 | $54,938 |
| Mean | $58,961 | $48,683 |
| Median | $59,717 | $48,098 |
| Interquartile 25% (IQ1) | $52,347 | $40,094 |
| Interquartile 75% (IQ3) | $65,355 | $55,303 |
| Interquartile Range (IQR) | $13,008 | $15,209 |
| Standard Deviation (Sample) | $11,452 | $11,920 |
| Standard Deviation (Population) | $11,346 | $11,822 |
Similar Demographics by Householder Income Under 25 years
Demographics Similar to Immigrants from South Eastern Asia by Householder Income Under 25 years
In terms of householder income under 25 years, the demographic groups most similar to Immigrants from South Eastern Asia are Immigrants from Korea ($55,716, a difference of 0.0%), Immigrants from Greece ($55,727, a difference of 0.020%), Immigrants from Guyana ($55,726, a difference of 0.020%), Immigrants from Belarus ($55,743, a difference of 0.050%), and Paraguayan ($55,614, a difference of 0.18%).
| Demographics | Rating | Rank | Householder Income Under 25 years |
| Immigrants | Israel | 100.0 /100 | #36 | Exceptional $55,913 |
| Immigrants | Russia | 100.0 /100 | #37 | Exceptional $55,891 |
| Immigrants | Iran | 100.0 /100 | #38 | Exceptional $55,880 |
| Immigrants | Belarus | 100.0 /100 | #39 | Exceptional $55,743 |
| Immigrants | Greece | 100.0 /100 | #40 | Exceptional $55,727 |
| Immigrants | Guyana | 100.0 /100 | #41 | Exceptional $55,726 |
| Immigrants | Korea | 100.0 /100 | #42 | Exceptional $55,716 |
| Immigrants | South Eastern Asia | 100.0 /100 | #43 | Exceptional $55,714 |
| Paraguayans | 100.0 /100 | #44 | Exceptional $55,614 |
| Spanish American Indians | 100.0 /100 | #45 | Exceptional $55,573 |
| Immigrants | Eastern Europe | 100.0 /100 | #46 | Exceptional $55,572 |
| Cambodians | 100.0 /100 | #47 | Exceptional $55,571 |
| Immigrants | Vietnam | 100.0 /100 | #48 | Exceptional $55,562 |
| Iranians | 100.0 /100 | #49 | Exceptional $55,548 |
| Puget Sound Salish | 100.0 /100 | #50 | Exceptional $55,543 |
Demographics Similar to Haitians by Householder Income Under 25 years
In terms of householder income under 25 years, the demographic groups most similar to Haitians are Hungarian ($50,247, a difference of 0.030%), Immigrants from Dominican Republic ($50,204, a difference of 0.050%), Hispanic or Latino ($50,279, a difference of 0.10%), Immigrants from Dominica ($50,301, a difference of 0.14%), and Fijian ($50,132, a difference of 0.20%).
| Demographics | Rating | Rank | Householder Income Under 25 years |
| Aleuts | 1.2 /100 | #255 | Tragic $50,377 |
| Immigrants | Cuba | 1.2 /100 | #256 | Tragic $50,374 |
| Lebanese | 1.1 /100 | #257 | Tragic $50,355 |
| Whites/Caucasians | 1.1 /100 | #258 | Tragic $50,336 |
| Immigrants | Dominica | 1.0 /100 | #259 | Tragic $50,301 |
| Hispanics or Latinos | 0.9 /100 | #260 | Tragic $50,279 |
| Hungarians | 0.9 /100 | #261 | Tragic $50,247 |
| Haitians | 0.8 /100 | #262 | Tragic $50,231 |
| Immigrants | Dominican Republic | 0.8 /100 | #263 | Tragic $50,204 |
| Fijians | 0.6 /100 | #264 | Tragic $50,132 |
| Belgians | 0.6 /100 | #265 | Tragic $50,113 |
| Immigrants | Venezuela | 0.6 /100 | #266 | Tragic $50,109 |
| Immigrants | Laos | 0.5 /100 | #267 | Tragic $50,041 |
| Venezuelans | 0.5 /100 | #268 | Tragic $50,011 |
| Ute | 0.5 /100 | #269 | Tragic $49,997 |