Immigrants from Oceania vs Haitian Householder Income Under 25 years
COMPARE
Immigrants from Oceania
Haitian
Householder Income Under 25 years
Householder Income Under 25 years Comparison
Immigrants from Oceania
Haitians
$53,680
HOUSEHOLDER INCOME UNDER 25 YEARS
97.5/ 100
METRIC RATING
112th/ 347
METRIC RANK
$50,231
HOUSEHOLDER INCOME UNDER 25 YEARS
0.8/ 100
METRIC RATING
262nd/ 347
METRIC RANK
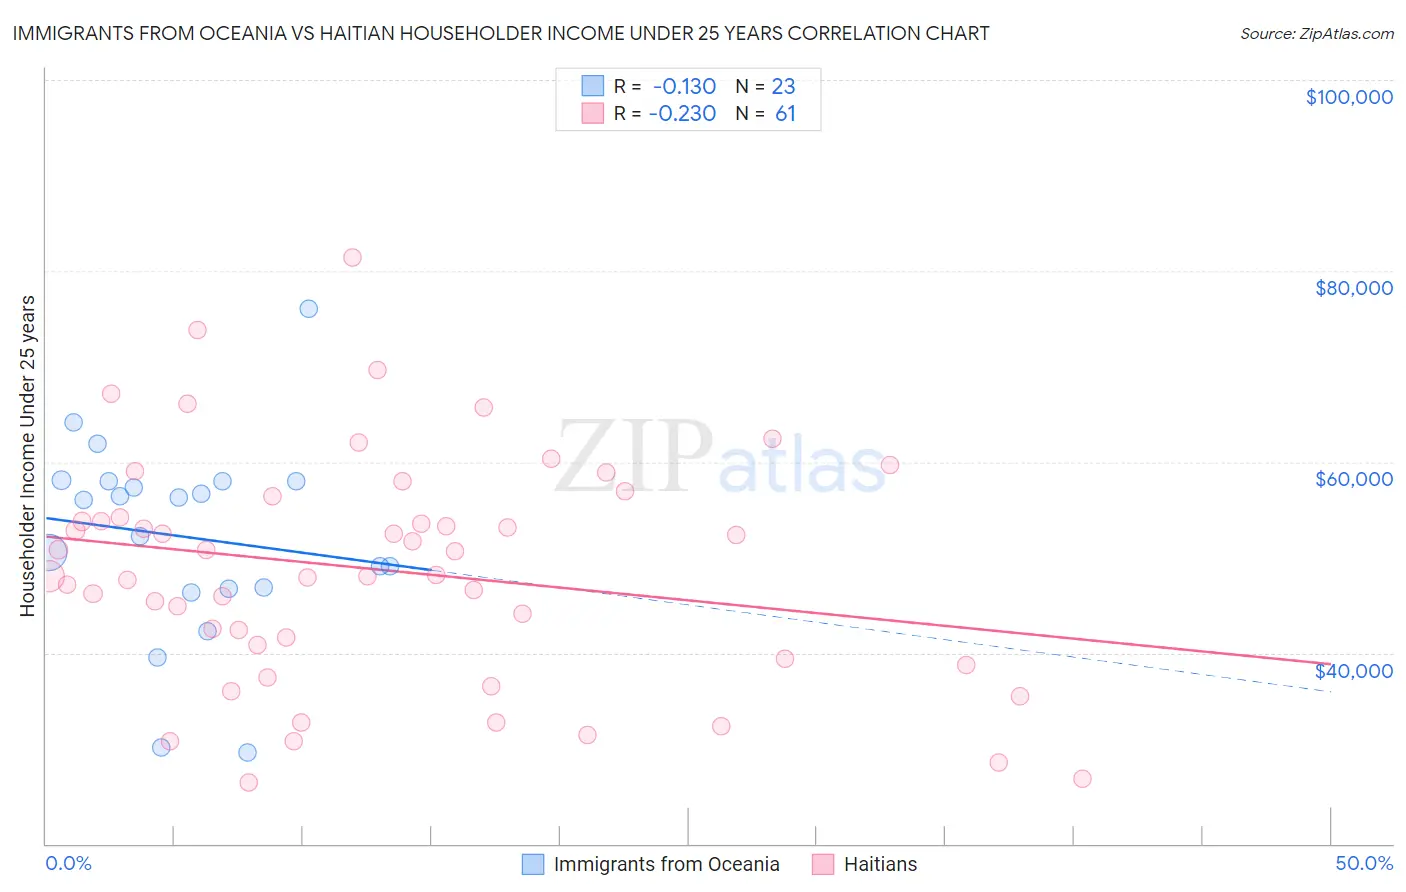
Immigrants from Oceania vs Haitian Householder Income Under 25 years Correlation Chart
The statistical analysis conducted on geographies consisting of 265,057,334 people shows a poor negative correlation between the proportion of Immigrants from Oceania and household income with householder under the age of 25 in the United States with a correlation coefficient (R) of -0.130 and weighted average of $53,680. Similarly, the statistical analysis conducted on geographies consisting of 247,862,749 people shows a weak negative correlation between the proportion of Haitians and household income with householder under the age of 25 in the United States with a correlation coefficient (R) of -0.230 and weighted average of $50,231, a difference of 6.9%.
Householder Income Under 25 years Correlation Summary
| Measurement | Immigrants from Oceania | Haitian |
| Minimum | $29,525 | $26,478 |
| Maximum | $76,023 | $81,415 |
| Range | $46,498 | $54,938 |
| Mean | $52,121 | $48,683 |
| Median | $56,037 | $48,098 |
| Interquartile 25% (IQ1) | $46,716 | $40,094 |
| Interquartile 75% (IQ3) | $58,036 | $55,303 |
| Interquartile Range (IQR) | $11,320 | $15,209 |
| Standard Deviation (Sample) | $10,477 | $11,920 |
| Standard Deviation (Population) | $10,247 | $11,822 |
Similar Demographics by Householder Income Under 25 years
Demographics Similar to Immigrants from Oceania by Householder Income Under 25 years
In terms of householder income under 25 years, the demographic groups most similar to Immigrants from Oceania are Immigrants from Colombia ($53,714, a difference of 0.060%), Greek ($53,715, a difference of 0.070%), Immigrants from Ecuador ($53,722, a difference of 0.080%), Romanian ($53,632, a difference of 0.090%), and Maltese ($53,735, a difference of 0.10%).
| Demographics | Rating | Rank | Householder Income Under 25 years |
| Immigrants | France | 98.1 /100 | #105 | Exceptional $53,805 |
| Albanians | 98.1 /100 | #106 | Exceptional $53,794 |
| Australians | 97.8 /100 | #107 | Exceptional $53,739 |
| Maltese | 97.8 /100 | #108 | Exceptional $53,735 |
| Immigrants | Ecuador | 97.7 /100 | #109 | Exceptional $53,722 |
| Greeks | 97.7 /100 | #110 | Exceptional $53,715 |
| Immigrants | Colombia | 97.7 /100 | #111 | Exceptional $53,714 |
| Immigrants | Oceania | 97.5 /100 | #112 | Exceptional $53,680 |
| Romanians | 97.2 /100 | #113 | Exceptional $53,632 |
| Immigrants | Sweden | 97.1 /100 | #114 | Exceptional $53,621 |
| Immigrants | Albania | 96.9 /100 | #115 | Exceptional $53,597 |
| Immigrants | Spain | 96.6 /100 | #116 | Exceptional $53,560 |
| Lithuanians | 96.6 /100 | #117 | Exceptional $53,552 |
| Immigrants | Switzerland | 96.3 /100 | #118 | Exceptional $53,528 |
| Italians | 95.4 /100 | #119 | Exceptional $53,426 |
Demographics Similar to Haitians by Householder Income Under 25 years
In terms of householder income under 25 years, the demographic groups most similar to Haitians are Hungarian ($50,247, a difference of 0.030%), Immigrants from Dominican Republic ($50,204, a difference of 0.050%), Hispanic or Latino ($50,279, a difference of 0.10%), Immigrants from Dominica ($50,301, a difference of 0.14%), and Fijian ($50,132, a difference of 0.20%).
| Demographics | Rating | Rank | Householder Income Under 25 years |
| Aleuts | 1.2 /100 | #255 | Tragic $50,377 |
| Immigrants | Cuba | 1.2 /100 | #256 | Tragic $50,374 |
| Lebanese | 1.1 /100 | #257 | Tragic $50,355 |
| Whites/Caucasians | 1.1 /100 | #258 | Tragic $50,336 |
| Immigrants | Dominica | 1.0 /100 | #259 | Tragic $50,301 |
| Hispanics or Latinos | 0.9 /100 | #260 | Tragic $50,279 |
| Hungarians | 0.9 /100 | #261 | Tragic $50,247 |
| Haitians | 0.8 /100 | #262 | Tragic $50,231 |
| Immigrants | Dominican Republic | 0.8 /100 | #263 | Tragic $50,204 |
| Fijians | 0.6 /100 | #264 | Tragic $50,132 |
| Belgians | 0.6 /100 | #265 | Tragic $50,113 |
| Immigrants | Venezuela | 0.6 /100 | #266 | Tragic $50,109 |
| Immigrants | Laos | 0.5 /100 | #267 | Tragic $50,041 |
| Venezuelans | 0.5 /100 | #268 | Tragic $50,011 |
| Ute | 0.5 /100 | #269 | Tragic $49,997 |