Cajun vs Armenian Median Male Earnings
COMPARE
Cajun
Armenian
Median Male Earnings
Median Male Earnings Comparison
Cajuns
Armenians
$52,325
MEDIAN MALE EARNINGS
10.7/ 100
METRIC RATING
212th/ 347
METRIC RANK
$58,134
MEDIAN MALE EARNINGS
97.3/ 100
METRIC RATING
104th/ 347
METRIC RANK
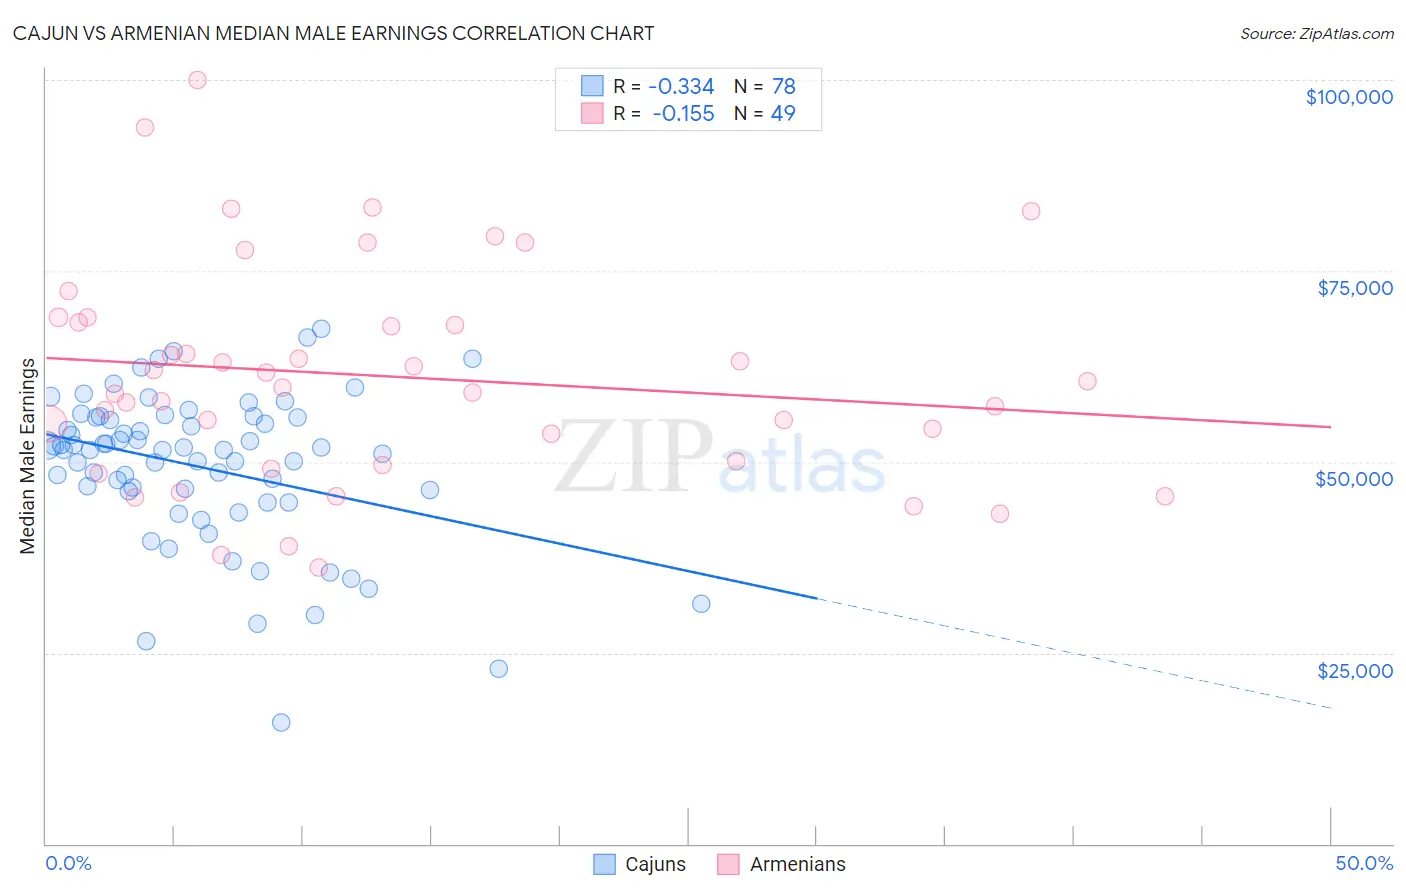
Cajun vs Armenian Median Male Earnings Correlation Chart
The statistical analysis conducted on geographies consisting of 149,660,715 people shows a mild negative correlation between the proportion of Cajuns and median male earnings in the United States with a correlation coefficient (R) of -0.334 and weighted average of $52,325. Similarly, the statistical analysis conducted on geographies consisting of 310,896,747 people shows a poor negative correlation between the proportion of Armenians and median male earnings in the United States with a correlation coefficient (R) of -0.155 and weighted average of $58,134, a difference of 11.1%.
Median Male Earnings Correlation Summary
| Measurement | Cajun | Armenian |
| Minimum | $15,945 | $36,151 |
| Maximum | $67,496 | $99,997 |
| Range | $51,551 | $63,846 |
| Mean | $49,309 | $61,183 |
| Median | $51,622 | $59,670 |
| Interquartile 25% (IQ1) | $46,199 | $49,867 |
| Interquartile 75% (IQ3) | $55,757 | $68,550 |
| Interquartile Range (IQR) | $9,558 | $18,683 |
| Standard Deviation (Sample) | $9,949 | $14,235 |
| Standard Deviation (Population) | $9,885 | $14,089 |
Similar Demographics by Median Male Earnings
Demographics Similar to Cajuns by Median Male Earnings
In terms of median male earnings, the demographic groups most similar to Cajuns are Native Hawaiian ($52,306, a difference of 0.040%), Tlingit-Haida ($52,409, a difference of 0.16%), Delaware ($52,412, a difference of 0.17%), Bermudan ($52,465, a difference of 0.27%), and Nonimmigrants ($52,170, a difference of 0.30%).
| Demographics | Rating | Rank | Median Male Earnings |
| Immigrants | Colombia | 15.0 /100 | #205 | Poor $52,725 |
| Immigrants | Iraq | 14.5 /100 | #206 | Poor $52,681 |
| Vietnamese | 12.7 /100 | #207 | Poor $52,525 |
| Venezuelans | 12.5 /100 | #208 | Poor $52,510 |
| Bermudans | 12.1 /100 | #209 | Poor $52,465 |
| Delaware | 11.5 /100 | #210 | Poor $52,412 |
| Tlingit-Haida | 11.5 /100 | #211 | Poor $52,409 |
| Cajuns | 10.7 /100 | #212 | Poor $52,325 |
| Native Hawaiians | 10.5 /100 | #213 | Poor $52,306 |
| Immigrants | Nonimmigrants | 9.3 /100 | #214 | Tragic $52,170 |
| Immigrants | Cameroon | 8.9 /100 | #215 | Tragic $52,119 |
| Immigrants | Venezuela | 8.3 /100 | #216 | Tragic $52,041 |
| Nigerians | 8.3 /100 | #217 | Tragic $52,039 |
| Immigrants | Panama | 7.7 /100 | #218 | Tragic $51,962 |
| Immigrants | Ghana | 6.9 /100 | #219 | Tragic $51,836 |
Demographics Similar to Armenians by Median Male Earnings
In terms of median male earnings, the demographic groups most similar to Armenians are Polish ($58,139, a difference of 0.010%), Immigrants from Western Asia ($58,131, a difference of 0.010%), Syrian ($58,187, a difference of 0.090%), Immigrants from Northern Africa ($58,008, a difference of 0.22%), and Serbian ($57,975, a difference of 0.27%).
| Demographics | Rating | Rank | Median Male Earnings |
| Northern Europeans | 98.2 /100 | #97 | Exceptional $58,588 |
| Jordanians | 98.1 /100 | #98 | Exceptional $58,500 |
| Immigrants | Poland | 98.0 /100 | #99 | Exceptional $58,452 |
| Assyrians/Chaldeans/Syriacs | 97.9 /100 | #100 | Exceptional $58,437 |
| Immigrants | Brazil | 97.7 /100 | #101 | Exceptional $58,324 |
| Syrians | 97.4 /100 | #102 | Exceptional $58,187 |
| Poles | 97.3 /100 | #103 | Exceptional $58,139 |
| Armenians | 97.3 /100 | #104 | Exceptional $58,134 |
| Immigrants | Western Asia | 97.3 /100 | #105 | Exceptional $58,131 |
| Immigrants | Northern Africa | 96.9 /100 | #106 | Exceptional $58,008 |
| Serbians | 96.8 /100 | #107 | Exceptional $57,975 |
| Immigrants | Uzbekistan | 96.7 /100 | #108 | Exceptional $57,941 |
| British | 96.5 /100 | #109 | Exceptional $57,890 |
| Palestinians | 96.2 /100 | #110 | Exceptional $57,778 |
| Europeans | 95.6 /100 | #111 | Exceptional $57,637 |