Immigrants from Armenia vs Armenian Median Family Income
COMPARE
Immigrants from Armenia
Armenian
Median Family Income
Median Family Income Comparison
Immigrants from Armenia
Armenians
$97,605
MEDIAN FAMILY INCOME
7.0/ 100
METRIC RATING
213th/ 347
METRIC RANK
$109,692
MEDIAN FAMILY INCOME
97.3/ 100
METRIC RATING
99th/ 347
METRIC RANK
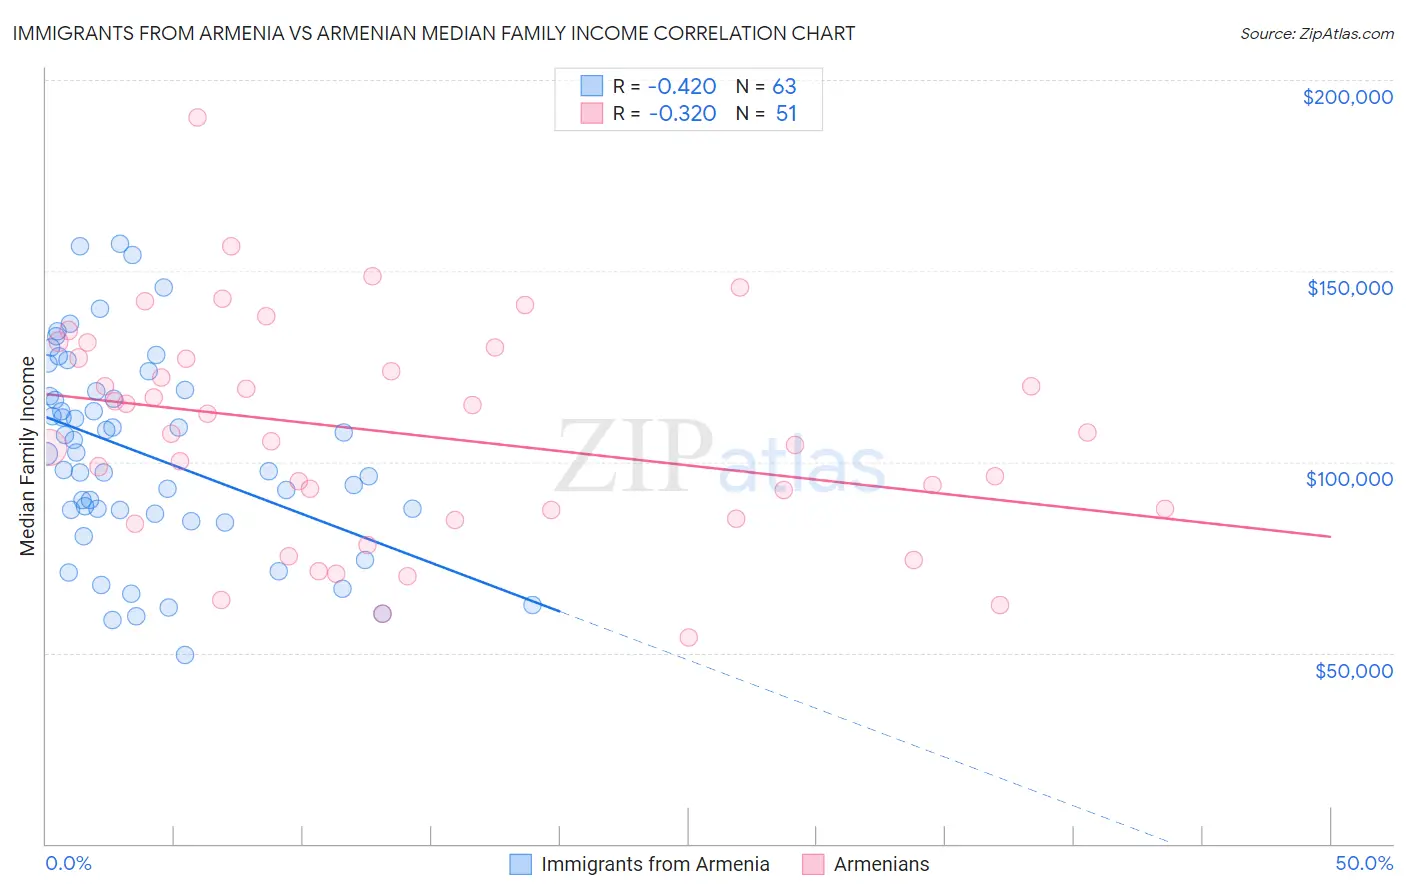
Immigrants from Armenia vs Armenian Median Family Income Correlation Chart
The statistical analysis conducted on geographies consisting of 97,713,870 people shows a moderate negative correlation between the proportion of Immigrants from Armenia and median family income in the United States with a correlation coefficient (R) of -0.420 and weighted average of $97,605. Similarly, the statistical analysis conducted on geographies consisting of 310,689,637 people shows a mild negative correlation between the proportion of Armenians and median family income in the United States with a correlation coefficient (R) of -0.320 and weighted average of $109,692, a difference of 12.4%.
Median Family Income Correlation Summary
| Measurement | Immigrants from Armenia | Armenian |
| Minimum | $49,583 | $54,063 |
| Maximum | $157,199 | $190,202 |
| Range | $107,616 | $136,139 |
| Mean | $101,713 | $107,343 |
| Median | $102,061 | $107,236 |
| Interquartile 25% (IQ1) | $86,292 | $85,128 |
| Interquartile 75% (IQ3) | $118,550 | $127,200 |
| Interquartile Range (IQR) | $32,258 | $42,071 |
| Standard Deviation (Sample) | $25,932 | $28,557 |
| Standard Deviation (Population) | $25,725 | $28,276 |
Similar Demographics by Median Family Income
Demographics Similar to Immigrants from Armenia by Median Family Income
In terms of median family income, the demographic groups most similar to Immigrants from Armenia are Bermudan ($97,577, a difference of 0.030%), Panamanian ($97,683, a difference of 0.080%), Nigerian ($97,522, a difference of 0.090%), Immigrants from Sudan ($97,737, a difference of 0.13%), and Immigrants from Bosnia and Herzegovina ($97,432, a difference of 0.18%).
| Demographics | Rating | Rank | Median Family Income |
| Immigrants | Iraq | 12.1 /100 | #206 | Poor $98,786 |
| Aleuts | 11.6 /100 | #207 | Poor $98,702 |
| Immigrants | Uruguay | 9.2 /100 | #208 | Tragic $98,205 |
| Immigrants | Colombia | 8.7 /100 | #209 | Tragic $98,067 |
| Puget Sound Salish | 8.2 /100 | #210 | Tragic $97,958 |
| Immigrants | Sudan | 7.4 /100 | #211 | Tragic $97,737 |
| Panamanians | 7.2 /100 | #212 | Tragic $97,683 |
| Immigrants | Armenia | 7.0 /100 | #213 | Tragic $97,605 |
| Bermudans | 6.9 /100 | #214 | Tragic $97,577 |
| Nigerians | 6.7 /100 | #215 | Tragic $97,522 |
| Immigrants | Bosnia and Herzegovina | 6.4 /100 | #216 | Tragic $97,432 |
| Japanese | 6.0 /100 | #217 | Tragic $97,288 |
| Immigrants | Cambodia | 5.8 /100 | #218 | Tragic $97,222 |
| Delaware | 5.1 /100 | #219 | Tragic $96,958 |
| Sudanese | 4.7 /100 | #220 | Tragic $96,783 |
Demographics Similar to Armenians by Median Family Income
In terms of median family income, the demographic groups most similar to Armenians are Macedonian ($109,668, a difference of 0.020%), Immigrants from Kuwait ($109,731, a difference of 0.040%), Immigrants from Ukraine ($109,645, a difference of 0.040%), Assyrian/Chaldean/Syriac ($109,622, a difference of 0.060%), and Jordanian ($109,865, a difference of 0.16%).
| Demographics | Rating | Rank | Median Family Income |
| Immigrants | Lebanon | 97.9 /100 | #92 | Exceptional $110,159 |
| Immigrants | Kazakhstan | 97.8 /100 | #93 | Exceptional $110,137 |
| Koreans | 97.8 /100 | #94 | Exceptional $110,103 |
| Zimbabweans | 97.7 /100 | #95 | Exceptional $110,011 |
| Immigrants | Moldova | 97.7 /100 | #96 | Exceptional $109,975 |
| Jordanians | 97.5 /100 | #97 | Exceptional $109,865 |
| Immigrants | Kuwait | 97.4 /100 | #98 | Exceptional $109,731 |
| Armenians | 97.3 /100 | #99 | Exceptional $109,692 |
| Macedonians | 97.3 /100 | #100 | Exceptional $109,668 |
| Immigrants | Ukraine | 97.2 /100 | #101 | Exceptional $109,645 |
| Assyrians/Chaldeans/Syriacs | 97.2 /100 | #102 | Exceptional $109,622 |
| Immigrants | Brazil | 96.9 /100 | #103 | Exceptional $109,418 |
| Palestinians | 96.9 /100 | #104 | Exceptional $109,413 |
| Syrians | 96.7 /100 | #105 | Exceptional $109,299 |
| Albanians | 96.4 /100 | #106 | Exceptional $109,136 |