Lebanese vs Armenian Median Family Income
COMPARE
Lebanese
Armenian
Median Family Income
Median Family Income Comparison
Lebanese
Armenians
$107,086
MEDIAN FAMILY INCOME
90.5/ 100
METRIC RATING
127th/ 347
METRIC RANK
$109,692
MEDIAN FAMILY INCOME
97.3/ 100
METRIC RATING
99th/ 347
METRIC RANK
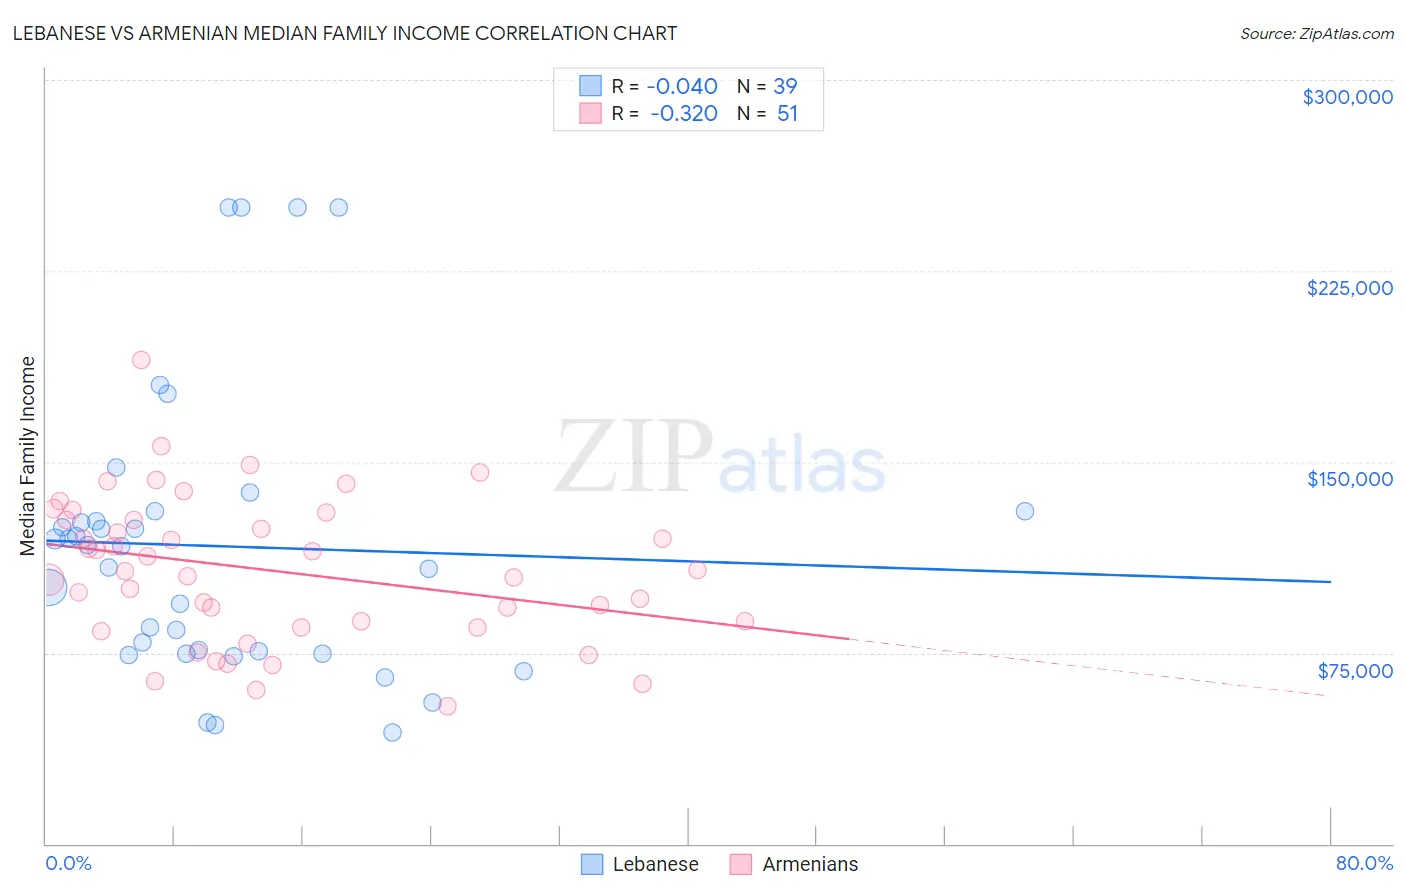
Lebanese vs Armenian Median Family Income Correlation Chart
The statistical analysis conducted on geographies consisting of 401,188,092 people shows no correlation between the proportion of Lebanese and median family income in the United States with a correlation coefficient (R) of -0.040 and weighted average of $107,086. Similarly, the statistical analysis conducted on geographies consisting of 310,689,637 people shows a mild negative correlation between the proportion of Armenians and median family income in the United States with a correlation coefficient (R) of -0.320 and weighted average of $109,692, a difference of 2.4%.
Median Family Income Correlation Summary
| Measurement | Lebanese | Armenian |
| Minimum | $43,594 | $54,063 |
| Maximum | $250,001 | $190,202 |
| Range | $206,407 | $136,139 |
| Mean | $116,877 | $107,343 |
| Median | $116,743 | $107,236 |
| Interquartile 25% (IQ1) | $74,798 | $85,128 |
| Interquartile 75% (IQ3) | $130,372 | $127,200 |
| Interquartile Range (IQR) | $55,574 | $42,071 |
| Standard Deviation (Sample) | $56,099 | $28,557 |
| Standard Deviation (Population) | $55,375 | $28,276 |
Similar Demographics by Median Family Income
Demographics Similar to Lebanese by Median Family Income
In terms of median family income, the demographic groups most similar to Lebanese are Serbian ($107,157, a difference of 0.070%), Immigrants from Ethiopia ($106,969, a difference of 0.11%), Arab ($106,952, a difference of 0.12%), Brazilian ($106,942, a difference of 0.13%), and Taiwanese ($107,295, a difference of 0.19%).
| Demographics | Rating | Rank | Median Family Income |
| Immigrants | Northern Africa | 94.3 /100 | #120 | Exceptional $108,161 |
| Europeans | 94.1 /100 | #121 | Exceptional $108,099 |
| Immigrants | Jordan | 92.9 /100 | #122 | Exceptional $107,715 |
| Carpatho Rusyns | 92.2 /100 | #123 | Exceptional $107,502 |
| Pakistanis | 91.7 /100 | #124 | Exceptional $107,390 |
| Taiwanese | 91.4 /100 | #125 | Exceptional $107,295 |
| Serbians | 90.8 /100 | #126 | Exceptional $107,157 |
| Lebanese | 90.5 /100 | #127 | Exceptional $107,086 |
| Immigrants | Ethiopia | 90.0 /100 | #128 | Excellent $106,969 |
| Arabs | 89.9 /100 | #129 | Excellent $106,952 |
| Brazilians | 89.8 /100 | #130 | Excellent $106,942 |
| Canadians | 88.1 /100 | #131 | Excellent $106,597 |
| Immigrants | Fiji | 87.8 /100 | #132 | Excellent $106,544 |
| Ugandans | 87.8 /100 | #133 | Excellent $106,541 |
| Immigrants | Oceania | 87.3 /100 | #134 | Excellent $106,453 |
Demographics Similar to Armenians by Median Family Income
In terms of median family income, the demographic groups most similar to Armenians are Macedonian ($109,668, a difference of 0.020%), Immigrants from Kuwait ($109,731, a difference of 0.040%), Immigrants from Ukraine ($109,645, a difference of 0.040%), Assyrian/Chaldean/Syriac ($109,622, a difference of 0.060%), and Jordanian ($109,865, a difference of 0.16%).
| Demographics | Rating | Rank | Median Family Income |
| Immigrants | Lebanon | 97.9 /100 | #92 | Exceptional $110,159 |
| Immigrants | Kazakhstan | 97.8 /100 | #93 | Exceptional $110,137 |
| Koreans | 97.8 /100 | #94 | Exceptional $110,103 |
| Zimbabweans | 97.7 /100 | #95 | Exceptional $110,011 |
| Immigrants | Moldova | 97.7 /100 | #96 | Exceptional $109,975 |
| Jordanians | 97.5 /100 | #97 | Exceptional $109,865 |
| Immigrants | Kuwait | 97.4 /100 | #98 | Exceptional $109,731 |
| Armenians | 97.3 /100 | #99 | Exceptional $109,692 |
| Macedonians | 97.3 /100 | #100 | Exceptional $109,668 |
| Immigrants | Ukraine | 97.2 /100 | #101 | Exceptional $109,645 |
| Assyrians/Chaldeans/Syriacs | 97.2 /100 | #102 | Exceptional $109,622 |
| Immigrants | Brazil | 96.9 /100 | #103 | Exceptional $109,418 |
| Palestinians | 96.9 /100 | #104 | Exceptional $109,413 |
| Syrians | 96.7 /100 | #105 | Exceptional $109,299 |
| Albanians | 96.4 /100 | #106 | Exceptional $109,136 |