Immigrants from Cuba vs Armenian Median Family Income
COMPARE
Immigrants from Cuba
Armenian
Median Family Income
Median Family Income Comparison
Immigrants from Cuba
Armenians
$78,249
MEDIAN FAMILY INCOME
0.0/ 100
METRIC RATING
336th/ 347
METRIC RANK
$109,692
MEDIAN FAMILY INCOME
97.3/ 100
METRIC RATING
99th/ 347
METRIC RANK
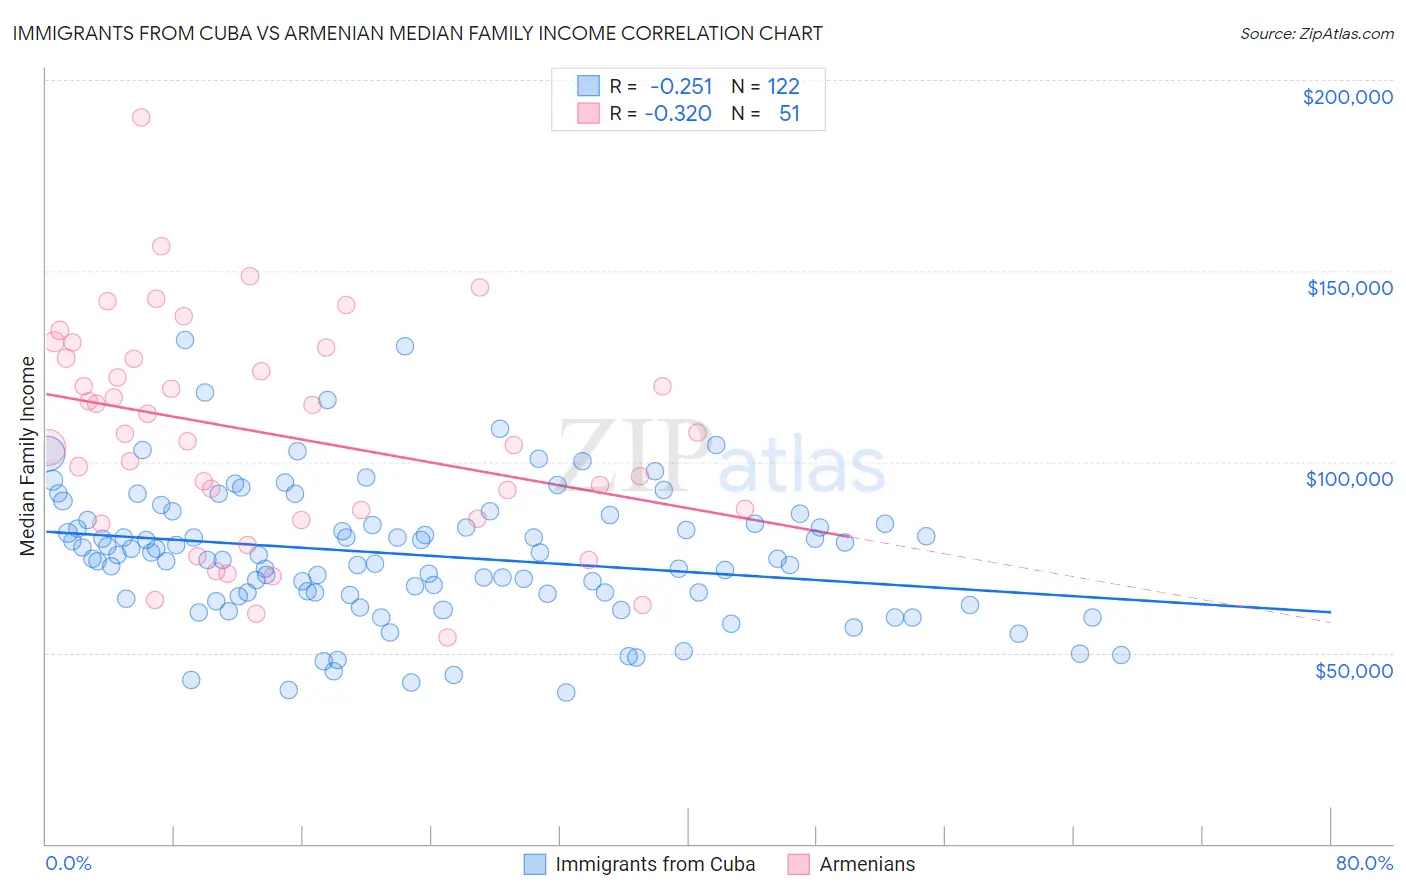
Immigrants from Cuba vs Armenian Median Family Income Correlation Chart
The statistical analysis conducted on geographies consisting of 325,826,414 people shows a weak negative correlation between the proportion of Immigrants from Cuba and median family income in the United States with a correlation coefficient (R) of -0.251 and weighted average of $78,249. Similarly, the statistical analysis conducted on geographies consisting of 310,689,637 people shows a mild negative correlation between the proportion of Armenians and median family income in the United States with a correlation coefficient (R) of -0.320 and weighted average of $109,692, a difference of 40.2%.
Median Family Income Correlation Summary
| Measurement | Immigrants from Cuba | Armenian |
| Minimum | $39,559 | $54,063 |
| Maximum | $131,935 | $190,202 |
| Range | $92,376 | $136,139 |
| Mean | $75,634 | $107,343 |
| Median | $75,235 | $107,236 |
| Interquartile 25% (IQ1) | $64,988 | $85,128 |
| Interquartile 75% (IQ3) | $83,903 | $127,200 |
| Interquartile Range (IQR) | $18,915 | $42,071 |
| Standard Deviation (Sample) | $17,632 | $28,557 |
| Standard Deviation (Population) | $17,559 | $28,276 |
Similar Demographics by Median Family Income
Demographics Similar to Immigrants from Cuba by Median Family Income
In terms of median family income, the demographic groups most similar to Immigrants from Cuba are Yuman ($78,055, a difference of 0.25%), Immigrants from Yemen ($77,457, a difference of 1.0%), Pima ($77,431, a difference of 1.1%), Yup'ik ($79,290, a difference of 1.3%), and Hopi ($77,188, a difference of 1.4%).
| Demographics | Rating | Rank | Median Family Income |
| Dutch West Indians | 0.0 /100 | #329 | Tragic $81,852 |
| Cheyenne | 0.0 /100 | #330 | Tragic $81,385 |
| Immigrants | Dominican Republic | 0.0 /100 | #331 | Tragic $81,233 |
| Natives/Alaskans | 0.0 /100 | #332 | Tragic $80,908 |
| Kiowa | 0.0 /100 | #333 | Tragic $80,885 |
| Menominee | 0.0 /100 | #334 | Tragic $79,563 |
| Yup'ik | 0.0 /100 | #335 | Tragic $79,290 |
| Immigrants | Cuba | 0.0 /100 | #336 | Tragic $78,249 |
| Yuman | 0.0 /100 | #337 | Tragic $78,055 |
| Immigrants | Yemen | 0.0 /100 | #338 | Tragic $77,457 |
| Pima | 0.0 /100 | #339 | Tragic $77,431 |
| Hopi | 0.0 /100 | #340 | Tragic $77,188 |
| Pueblo | 0.0 /100 | #341 | Tragic $76,880 |
| Crow | 0.0 /100 | #342 | Tragic $76,605 |
| Houma | 0.0 /100 | #343 | Tragic $76,188 |
Demographics Similar to Armenians by Median Family Income
In terms of median family income, the demographic groups most similar to Armenians are Macedonian ($109,668, a difference of 0.020%), Immigrants from Kuwait ($109,731, a difference of 0.040%), Immigrants from Ukraine ($109,645, a difference of 0.040%), Assyrian/Chaldean/Syriac ($109,622, a difference of 0.060%), and Jordanian ($109,865, a difference of 0.16%).
| Demographics | Rating | Rank | Median Family Income |
| Immigrants | Lebanon | 97.9 /100 | #92 | Exceptional $110,159 |
| Immigrants | Kazakhstan | 97.8 /100 | #93 | Exceptional $110,137 |
| Koreans | 97.8 /100 | #94 | Exceptional $110,103 |
| Zimbabweans | 97.7 /100 | #95 | Exceptional $110,011 |
| Immigrants | Moldova | 97.7 /100 | #96 | Exceptional $109,975 |
| Jordanians | 97.5 /100 | #97 | Exceptional $109,865 |
| Immigrants | Kuwait | 97.4 /100 | #98 | Exceptional $109,731 |
| Armenians | 97.3 /100 | #99 | Exceptional $109,692 |
| Macedonians | 97.3 /100 | #100 | Exceptional $109,668 |
| Immigrants | Ukraine | 97.2 /100 | #101 | Exceptional $109,645 |
| Assyrians/Chaldeans/Syriacs | 97.2 /100 | #102 | Exceptional $109,622 |
| Immigrants | Brazil | 96.9 /100 | #103 | Exceptional $109,418 |
| Palestinians | 96.9 /100 | #104 | Exceptional $109,413 |
| Syrians | 96.7 /100 | #105 | Exceptional $109,299 |
| Albanians | 96.4 /100 | #106 | Exceptional $109,136 |