Alaskan Athabascan vs Soviet Union Median Female Earnings
COMPARE
Alaskan Athabascan
Soviet Union
Median Female Earnings
Median Female Earnings Comparison
Alaskan Athabascans
Soviet Union
$37,905
MEDIAN FEMALE EARNINGS
2.3/ 100
METRIC RATING
248th/ 347
METRIC RANK
$46,556
MEDIAN FEMALE EARNINGS
100.0/ 100
METRIC RATING
14th/ 347
METRIC RANK
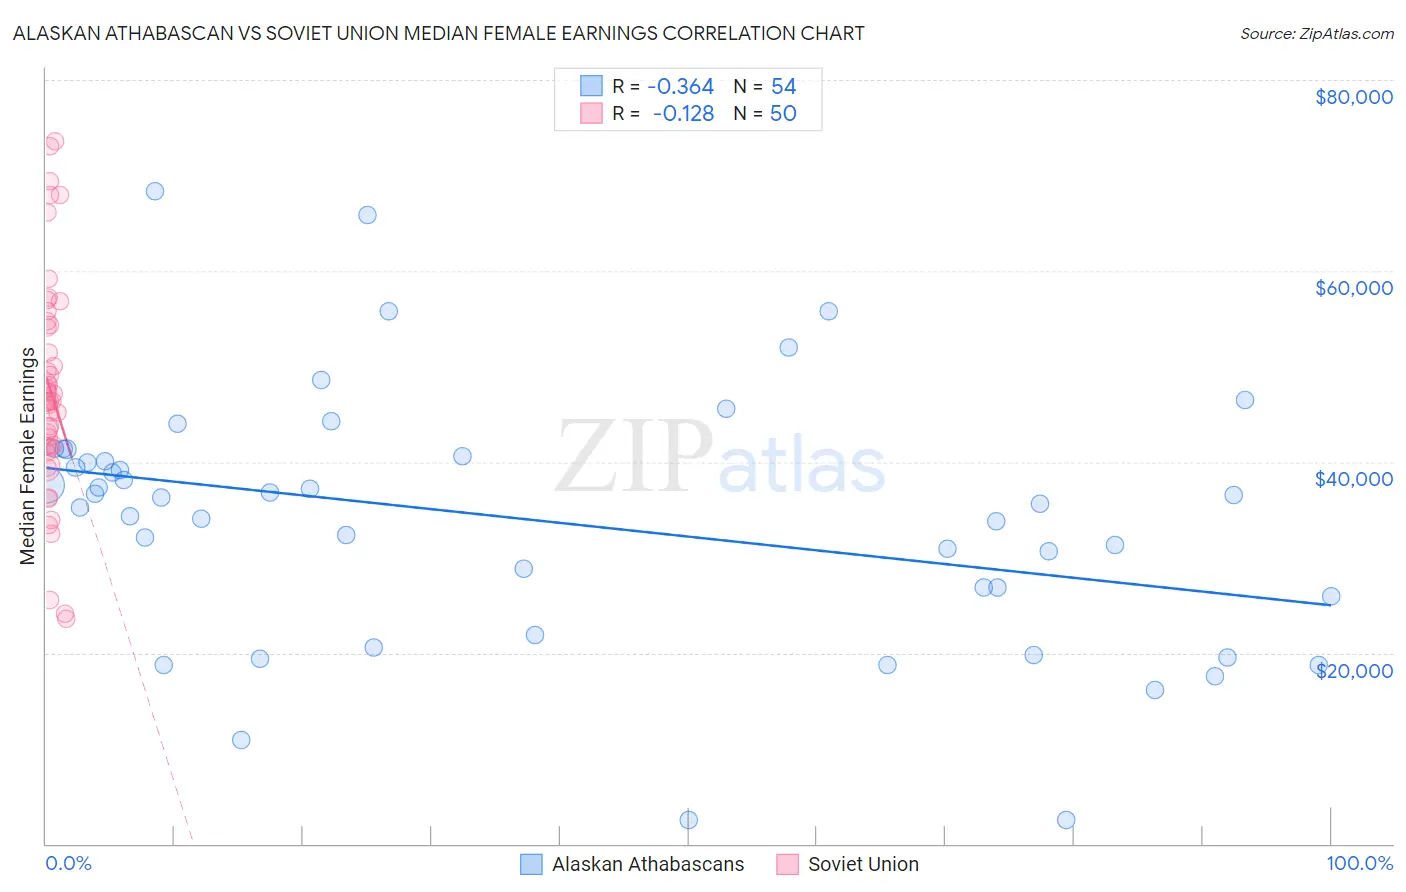
Alaskan Athabascan vs Soviet Union Median Female Earnings Correlation Chart
The statistical analysis conducted on geographies consisting of 45,800,514 people shows a mild negative correlation between the proportion of Alaskan Athabascans and median female earnings in the United States with a correlation coefficient (R) of -0.364 and weighted average of $37,905. Similarly, the statistical analysis conducted on geographies consisting of 43,506,452 people shows a poor negative correlation between the proportion of Soviet Union and median female earnings in the United States with a correlation coefficient (R) of -0.128 and weighted average of $46,556, a difference of 22.8%.
Median Female Earnings Correlation Summary
| Measurement | Alaskan Athabascan | Soviet Union |
| Minimum | $2,499 | $23,611 |
| Maximum | $68,290 | $73,520 |
| Range | $65,791 | $49,909 |
| Mean | $33,896 | $47,577 |
| Median | $35,954 | $46,321 |
| Interquartile 25% (IQ1) | $25,923 | $41,646 |
| Interquartile 75% (IQ3) | $40,625 | $54,381 |
| Interquartile Range (IQR) | $14,702 | $12,735 |
| Standard Deviation (Sample) | $13,459 | $11,528 |
| Standard Deviation (Population) | $13,333 | $11,412 |
Similar Demographics by Median Female Earnings
Demographics Similar to Alaskan Athabascans by Median Female Earnings
In terms of median female earnings, the demographic groups most similar to Alaskan Athabascans are Swiss ($37,904, a difference of 0.0%), Immigrants from Somalia ($37,914, a difference of 0.020%), Immigrants from Iraq ($37,864, a difference of 0.11%), Welsh ($37,856, a difference of 0.13%), and Immigrants from Middle Africa ($37,965, a difference of 0.16%).
| Demographics | Rating | Rank | Median Female Earnings |
| Spanish | 3.5 /100 | #241 | Tragic $38,098 |
| Immigrants | Burma/Myanmar | 3.0 /100 | #242 | Tragic $38,028 |
| Germans | 2.8 /100 | #243 | Tragic $37,986 |
| Immigrants | Liberia | 2.7 /100 | #244 | Tragic $37,970 |
| Immigrants | Middle Africa | 2.7 /100 | #245 | Tragic $37,965 |
| Delaware | 2.6 /100 | #246 | Tragic $37,964 |
| Immigrants | Somalia | 2.4 /100 | #247 | Tragic $37,914 |
| Alaskan Athabascans | 2.3 /100 | #248 | Tragic $37,905 |
| Swiss | 2.3 /100 | #249 | Tragic $37,904 |
| Immigrants | Iraq | 2.2 /100 | #250 | Tragic $37,864 |
| Welsh | 2.1 /100 | #251 | Tragic $37,856 |
| Immigrants | Dominica | 2.0 /100 | #252 | Tragic $37,825 |
| Danes | 1.6 /100 | #253 | Tragic $37,730 |
| Whites/Caucasians | 1.1 /100 | #254 | Tragic $37,531 |
| Colville | 1.1 /100 | #255 | Tragic $37,514 |
Demographics Similar to Soviet Union by Median Female Earnings
In terms of median female earnings, the demographic groups most similar to Soviet Union are Immigrants from Australia ($46,573, a difference of 0.040%), Immigrants from Eastern Asia ($46,502, a difference of 0.11%), Indian (Asian) ($46,481, a difference of 0.16%), Immigrants from South Central Asia ($46,324, a difference of 0.50%), and Immigrants from Israel ($46,902, a difference of 0.74%).
| Demographics | Rating | Rank | Median Female Earnings |
| Thais | 100.0 /100 | #7 | Exceptional $47,577 |
| Iranians | 100.0 /100 | #8 | Exceptional $47,421 |
| Immigrants | Iran | 100.0 /100 | #9 | Exceptional $47,154 |
| Immigrants | China | 100.0 /100 | #10 | Exceptional $46,972 |
| Okinawans | 100.0 /100 | #11 | Exceptional $46,905 |
| Immigrants | Israel | 100.0 /100 | #12 | Exceptional $46,902 |
| Immigrants | Australia | 100.0 /100 | #13 | Exceptional $46,573 |
| Soviet Union | 100.0 /100 | #14 | Exceptional $46,556 |
| Immigrants | Eastern Asia | 100.0 /100 | #15 | Exceptional $46,502 |
| Indians (Asian) | 100.0 /100 | #16 | Exceptional $46,481 |
| Immigrants | South Central Asia | 100.0 /100 | #17 | Exceptional $46,324 |
| Cypriots | 100.0 /100 | #18 | Exceptional $45,570 |
| Eastern Europeans | 100.0 /100 | #19 | Exceptional $45,385 |
| Immigrants | Japan | 100.0 /100 | #20 | Exceptional $45,323 |
| Cambodians | 100.0 /100 | #21 | Exceptional $45,014 |