Dutch vs Soviet Union Median Female Earnings
COMPARE
Dutch
Soviet Union
Median Female Earnings
Median Female Earnings Comparison
Dutch
Soviet Union
$37,339
MEDIAN FEMALE EARNINGS
0.7/ 100
METRIC RATING
260th/ 347
METRIC RANK
$46,556
MEDIAN FEMALE EARNINGS
100.0/ 100
METRIC RATING
14th/ 347
METRIC RANK
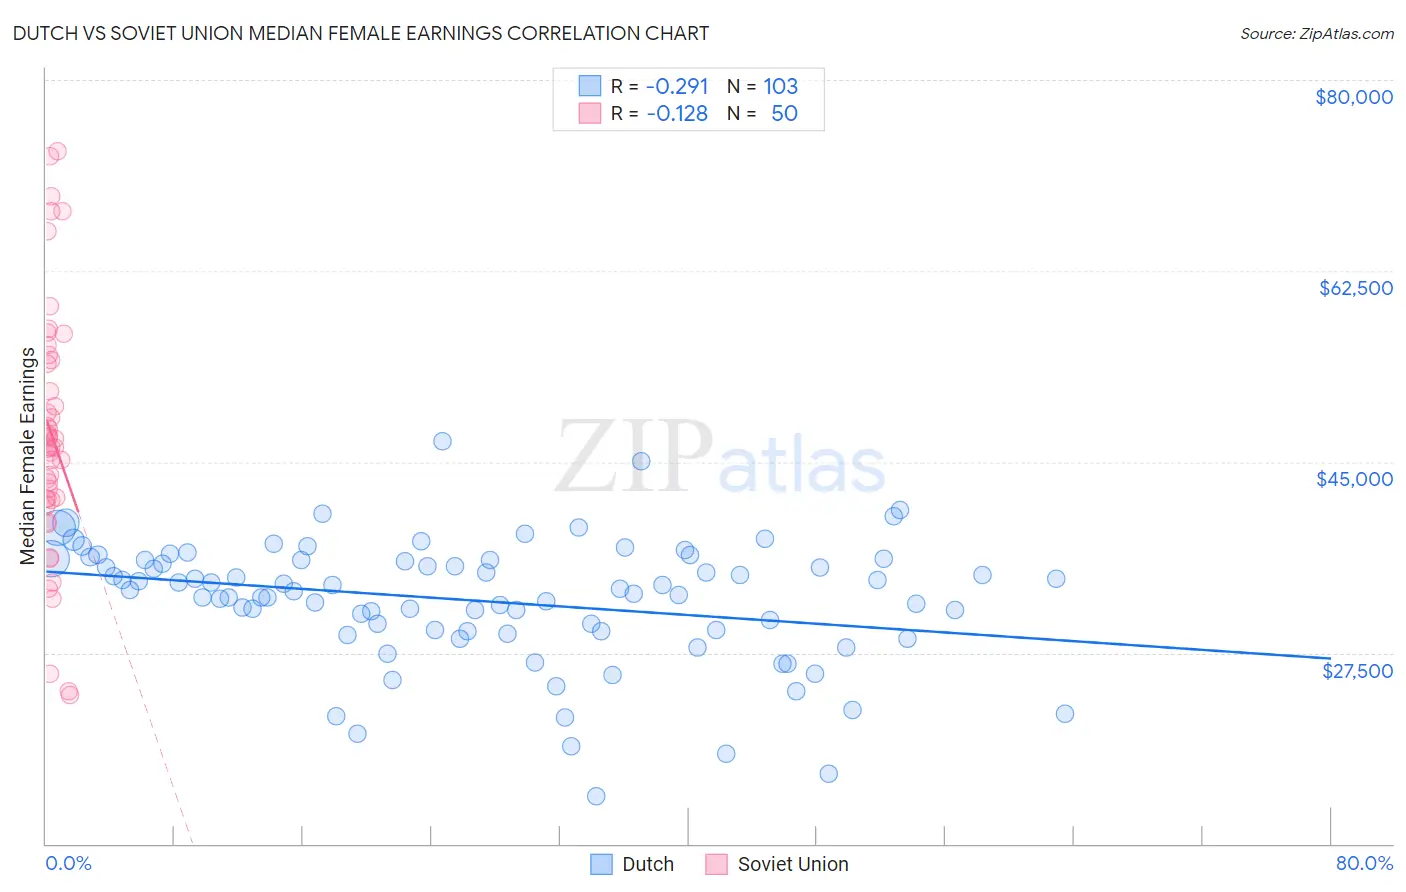
Dutch vs Soviet Union Median Female Earnings Correlation Chart
The statistical analysis conducted on geographies consisting of 553,021,757 people shows a weak negative correlation between the proportion of Dutch and median female earnings in the United States with a correlation coefficient (R) of -0.291 and weighted average of $37,339. Similarly, the statistical analysis conducted on geographies consisting of 43,506,452 people shows a poor negative correlation between the proportion of Soviet Union and median female earnings in the United States with a correlation coefficient (R) of -0.128 and weighted average of $46,556, a difference of 24.7%.
Median Female Earnings Correlation Summary
| Measurement | Dutch | Soviet Union |
| Minimum | $14,375 | $23,611 |
| Maximum | $46,907 | $73,520 |
| Range | $32,532 | $49,909 |
| Mean | $32,260 | $47,577 |
| Median | $33,299 | $46,321 |
| Interquartile 25% (IQ1) | $29,508 | $41,646 |
| Interquartile 75% (IQ3) | $35,979 | $54,381 |
| Interquartile Range (IQR) | $6,471 | $12,735 |
| Standard Deviation (Sample) | $5,704 | $11,528 |
| Standard Deviation (Population) | $5,676 | $11,412 |
Similar Demographics by Median Female Earnings
Demographics Similar to Dutch by Median Female Earnings
In terms of median female earnings, the demographic groups most similar to Dutch are Malaysian ($37,298, a difference of 0.11%), Scotch-Irish ($37,383, a difference of 0.12%), Venezuelan ($37,282, a difference of 0.15%), Belizean ($37,429, a difference of 0.24%), and Hawaiian ($37,497, a difference of 0.42%).
| Demographics | Rating | Rank | Median Female Earnings |
| Danes | 1.6 /100 | #253 | Tragic $37,730 |
| Whites/Caucasians | 1.1 /100 | #254 | Tragic $37,531 |
| Colville | 1.1 /100 | #255 | Tragic $37,514 |
| Samoans | 1.0 /100 | #256 | Tragic $37,498 |
| Hawaiians | 1.0 /100 | #257 | Tragic $37,497 |
| Belizeans | 0.9 /100 | #258 | Tragic $37,429 |
| Scotch-Irish | 0.8 /100 | #259 | Tragic $37,383 |
| Dutch | 0.7 /100 | #260 | Tragic $37,339 |
| Malaysians | 0.7 /100 | #261 | Tragic $37,298 |
| Venezuelans | 0.7 /100 | #262 | Tragic $37,282 |
| German Russians | 0.5 /100 | #263 | Tragic $37,105 |
| Salvadorans | 0.4 /100 | #264 | Tragic $37,083 |
| Immigrants | Belize | 0.4 /100 | #265 | Tragic $37,056 |
| Dominicans | 0.4 /100 | #266 | Tragic $37,046 |
| Immigrants | Nonimmigrants | 0.4 /100 | #267 | Tragic $37,024 |
Demographics Similar to Soviet Union by Median Female Earnings
In terms of median female earnings, the demographic groups most similar to Soviet Union are Immigrants from Australia ($46,573, a difference of 0.040%), Immigrants from Eastern Asia ($46,502, a difference of 0.11%), Indian (Asian) ($46,481, a difference of 0.16%), Immigrants from South Central Asia ($46,324, a difference of 0.50%), and Immigrants from Israel ($46,902, a difference of 0.74%).
| Demographics | Rating | Rank | Median Female Earnings |
| Thais | 100.0 /100 | #7 | Exceptional $47,577 |
| Iranians | 100.0 /100 | #8 | Exceptional $47,421 |
| Immigrants | Iran | 100.0 /100 | #9 | Exceptional $47,154 |
| Immigrants | China | 100.0 /100 | #10 | Exceptional $46,972 |
| Okinawans | 100.0 /100 | #11 | Exceptional $46,905 |
| Immigrants | Israel | 100.0 /100 | #12 | Exceptional $46,902 |
| Immigrants | Australia | 100.0 /100 | #13 | Exceptional $46,573 |
| Soviet Union | 100.0 /100 | #14 | Exceptional $46,556 |
| Immigrants | Eastern Asia | 100.0 /100 | #15 | Exceptional $46,502 |
| Indians (Asian) | 100.0 /100 | #16 | Exceptional $46,481 |
| Immigrants | South Central Asia | 100.0 /100 | #17 | Exceptional $46,324 |
| Cypriots | 100.0 /100 | #18 | Exceptional $45,570 |
| Eastern Europeans | 100.0 /100 | #19 | Exceptional $45,385 |
| Immigrants | Japan | 100.0 /100 | #20 | Exceptional $45,323 |
| Cambodians | 100.0 /100 | #21 | Exceptional $45,014 |