Asian vs Israeli Median Female Earnings
COMPARE
Asian
Israeli
Median Female Earnings
Median Female Earnings Comparison
Asians
Israelis
$44,586
MEDIAN FEMALE EARNINGS
100.0/ 100
METRIC RATING
30th/ 347
METRIC RANK
$43,852
MEDIAN FEMALE EARNINGS
100.0/ 100
METRIC RATING
39th/ 347
METRIC RANK
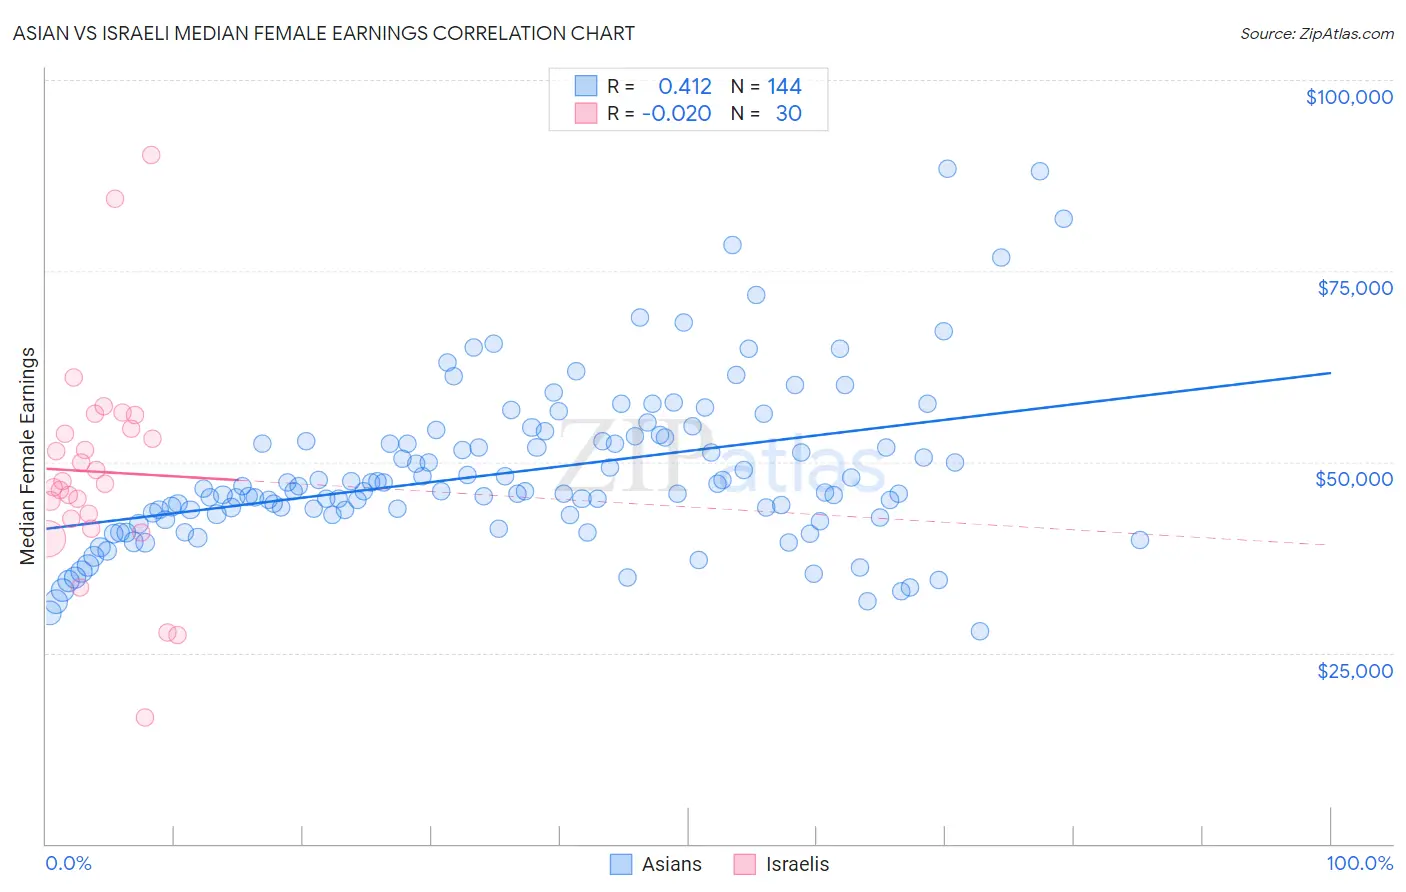
Asian vs Israeli Median Female Earnings Correlation Chart
The statistical analysis conducted on geographies consisting of 549,997,902 people shows a moderate positive correlation between the proportion of Asians and median female earnings in the United States with a correlation coefficient (R) of 0.412 and weighted average of $44,586. Similarly, the statistical analysis conducted on geographies consisting of 211,198,030 people shows no correlation between the proportion of Israelis and median female earnings in the United States with a correlation coefficient (R) of -0.020 and weighted average of $43,852, a difference of 1.7%.
Median Female Earnings Correlation Summary
| Measurement | Asian | Israeli |
| Minimum | $27,791 | $16,513 |
| Maximum | $88,421 | $90,109 |
| Range | $60,630 | $73,596 |
| Mean | $48,672 | $48,703 |
| Median | $46,136 | $47,323 |
| Interquartile 25% (IQ1) | $43,055 | $42,485 |
| Interquartile 75% (IQ3) | $52,970 | $54,278 |
| Interquartile Range (IQR) | $9,915 | $11,793 |
| Standard Deviation (Sample) | $10,662 | $14,338 |
| Standard Deviation (Population) | $10,625 | $14,097 |
Demographics Similar to Asians and Israelis by Median Female Earnings
In terms of median female earnings, the demographic groups most similar to Asians are Immigrants from Belgium ($44,587, a difference of 0.0%), Immigrants from France ($44,541, a difference of 0.10%), Immigrants from Russia ($44,680, a difference of 0.21%), Turkish ($44,695, a difference of 0.24%), and Immigrants from Belarus ($44,757, a difference of 0.38%). Similarly, the demographic groups most similar to Israelis are Immigrants from Malaysia ($43,835, a difference of 0.040%), Latvian ($43,941, a difference of 0.20%), Immigrants from Switzerland ($43,996, a difference of 0.33%), Bhutanese ($43,648, a difference of 0.47%), and Immigrants from Denmark ($43,646, a difference of 0.47%).
| Demographics | Rating | Rank | Median Female Earnings |
| Immigrants | Korea | 100.0 /100 | #24 | Exceptional $44,847 |
| Immigrants | Sweden | 100.0 /100 | #25 | Exceptional $44,774 |
| Immigrants | Belarus | 100.0 /100 | #26 | Exceptional $44,757 |
| Turks | 100.0 /100 | #27 | Exceptional $44,695 |
| Immigrants | Russia | 100.0 /100 | #28 | Exceptional $44,680 |
| Immigrants | Belgium | 100.0 /100 | #29 | Exceptional $44,587 |
| Asians | 100.0 /100 | #30 | Exceptional $44,586 |
| Immigrants | France | 100.0 /100 | #31 | Exceptional $44,541 |
| Immigrants | Northern Europe | 100.0 /100 | #32 | Exceptional $44,366 |
| Immigrants | Asia | 100.0 /100 | #33 | Exceptional $44,198 |
| Russians | 100.0 /100 | #34 | Exceptional $44,169 |
| Immigrants | Sri Lanka | 100.0 /100 | #35 | Exceptional $44,161 |
| Immigrants | Turkey | 100.0 /100 | #36 | Exceptional $44,066 |
| Immigrants | Switzerland | 100.0 /100 | #37 | Exceptional $43,996 |
| Latvians | 100.0 /100 | #38 | Exceptional $43,941 |
| Israelis | 100.0 /100 | #39 | Exceptional $43,852 |
| Immigrants | Malaysia | 100.0 /100 | #40 | Exceptional $43,835 |
| Bhutanese | 100.0 /100 | #41 | Exceptional $43,648 |
| Immigrants | Denmark | 100.0 /100 | #42 | Exceptional $43,646 |
| Bulgarians | 100.0 /100 | #43 | Exceptional $43,638 |
| Immigrants | Czechoslovakia | 100.0 /100 | #44 | Exceptional $43,571 |