Asian vs Luxembourger Median Female Earnings
COMPARE
Asian
Luxembourger
Median Female Earnings
Median Female Earnings Comparison
Asians
Luxembourgers
$44,586
MEDIAN FEMALE EARNINGS
100.0/ 100
METRIC RATING
30th/ 347
METRIC RANK
$39,891
MEDIAN FEMALE EARNINGS
59.9/ 100
METRIC RATING
167th/ 347
METRIC RANK
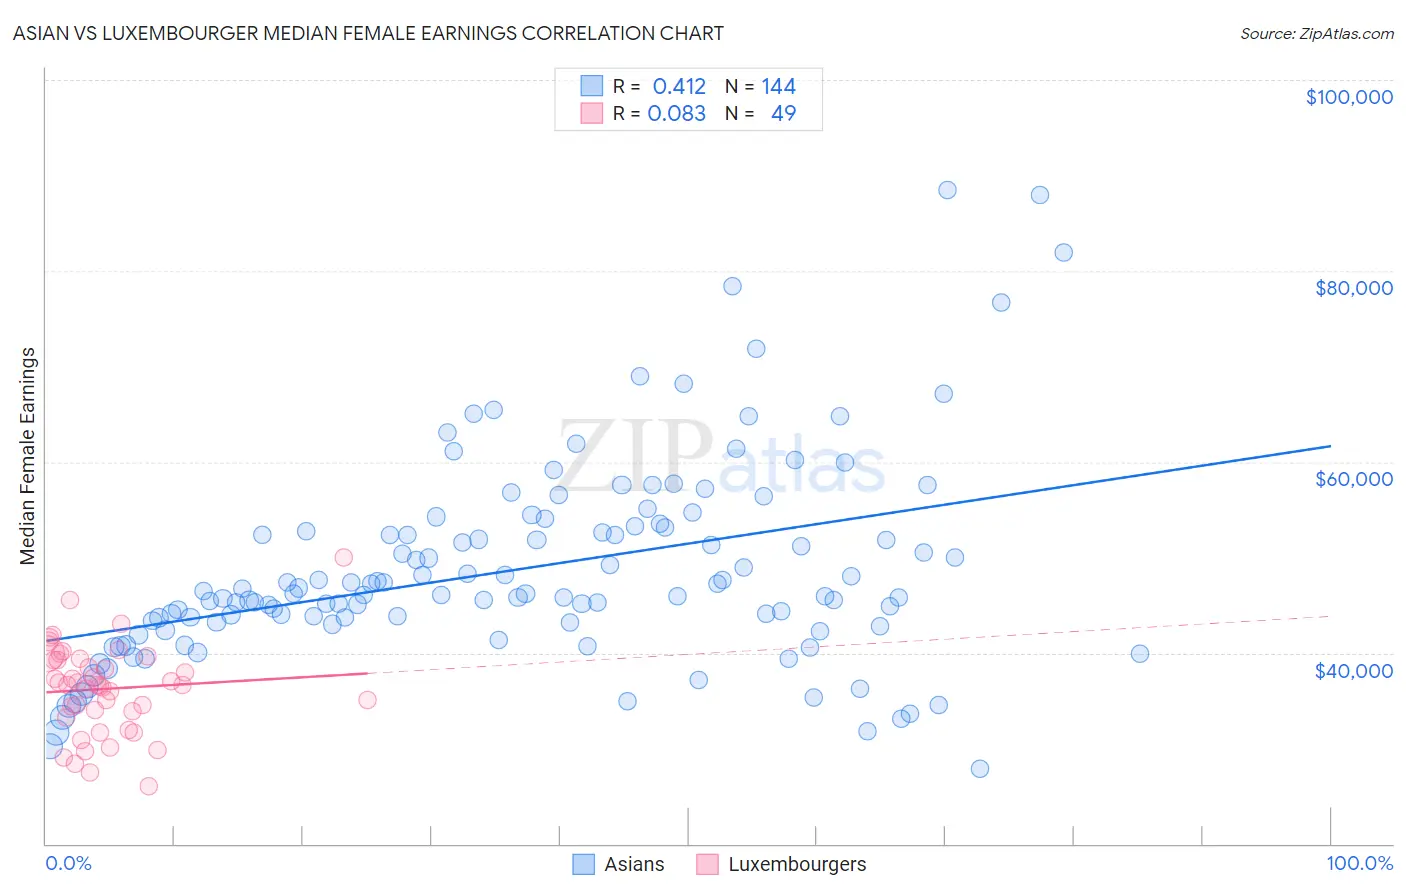
Asian vs Luxembourger Median Female Earnings Correlation Chart
The statistical analysis conducted on geographies consisting of 549,997,902 people shows a moderate positive correlation between the proportion of Asians and median female earnings in the United States with a correlation coefficient (R) of 0.412 and weighted average of $44,586. Similarly, the statistical analysis conducted on geographies consisting of 144,650,946 people shows a slight positive correlation between the proportion of Luxembourgers and median female earnings in the United States with a correlation coefficient (R) of 0.083 and weighted average of $39,891, a difference of 11.8%.
Median Female Earnings Correlation Summary
| Measurement | Asian | Luxembourger |
| Minimum | $27,791 | $26,088 |
| Maximum | $88,421 | $50,000 |
| Range | $60,630 | $23,912 |
| Mean | $48,672 | $36,224 |
| Median | $46,136 | $36,648 |
| Interquartile 25% (IQ1) | $43,055 | $33,540 |
| Interquartile 75% (IQ3) | $52,970 | $39,298 |
| Interquartile Range (IQR) | $9,915 | $5,758 |
| Standard Deviation (Sample) | $10,662 | $4,701 |
| Standard Deviation (Population) | $10,625 | $4,653 |
Similar Demographics by Median Female Earnings
Demographics Similar to Asians by Median Female Earnings
In terms of median female earnings, the demographic groups most similar to Asians are Immigrants from Belgium ($44,587, a difference of 0.0%), Immigrants from France ($44,541, a difference of 0.10%), Immigrants from Russia ($44,680, a difference of 0.21%), Turkish ($44,695, a difference of 0.24%), and Immigrants from Belarus ($44,757, a difference of 0.38%).
| Demographics | Rating | Rank | Median Female Earnings |
| Burmese | 100.0 /100 | #23 | Exceptional $44,911 |
| Immigrants | Korea | 100.0 /100 | #24 | Exceptional $44,847 |
| Immigrants | Sweden | 100.0 /100 | #25 | Exceptional $44,774 |
| Immigrants | Belarus | 100.0 /100 | #26 | Exceptional $44,757 |
| Turks | 100.0 /100 | #27 | Exceptional $44,695 |
| Immigrants | Russia | 100.0 /100 | #28 | Exceptional $44,680 |
| Immigrants | Belgium | 100.0 /100 | #29 | Exceptional $44,587 |
| Asians | 100.0 /100 | #30 | Exceptional $44,586 |
| Immigrants | France | 100.0 /100 | #31 | Exceptional $44,541 |
| Immigrants | Northern Europe | 100.0 /100 | #32 | Exceptional $44,366 |
| Immigrants | Asia | 100.0 /100 | #33 | Exceptional $44,198 |
| Russians | 100.0 /100 | #34 | Exceptional $44,169 |
| Immigrants | Sri Lanka | 100.0 /100 | #35 | Exceptional $44,161 |
| Immigrants | Turkey | 100.0 /100 | #36 | Exceptional $44,066 |
| Immigrants | Switzerland | 100.0 /100 | #37 | Exceptional $43,996 |
Demographics Similar to Luxembourgers by Median Female Earnings
In terms of median female earnings, the demographic groups most similar to Luxembourgers are Immigrants from Ghana ($39,894, a difference of 0.010%), Immigrants from Bangladesh ($39,910, a difference of 0.050%), Immigrants from Peru ($39,871, a difference of 0.050%), Kenyan ($39,860, a difference of 0.080%), and Immigrants from Saudi Arabia ($39,952, a difference of 0.15%).
| Demographics | Rating | Rank | Median Female Earnings |
| Inupiat | 68.9 /100 | #160 | Good $40,080 |
| Alsatians | 68.0 /100 | #161 | Good $40,060 |
| South American Indians | 66.1 /100 | #162 | Good $40,019 |
| Lebanese | 65.5 /100 | #163 | Good $40,006 |
| Immigrants | Saudi Arabia | 62.9 /100 | #164 | Good $39,952 |
| Immigrants | Bangladesh | 60.8 /100 | #165 | Good $39,910 |
| Immigrants | Ghana | 60.0 /100 | #166 | Good $39,894 |
| Luxembourgers | 59.9 /100 | #167 | Average $39,891 |
| Immigrants | Peru | 58.9 /100 | #168 | Average $39,871 |
| Kenyans | 58.4 /100 | #169 | Average $39,860 |
| Slovenes | 56.2 /100 | #170 | Average $39,817 |
| Immigrants | Portugal | 54.7 /100 | #171 | Average $39,788 |
| British | 53.8 /100 | #172 | Average $39,772 |
| Canadians | 51.4 /100 | #173 | Average $39,724 |
| South Americans | 50.0 /100 | #174 | Average $39,698 |