Polish vs Immigrants from Turkey Median Household Income
COMPARE
Polish
Immigrants from Turkey
Median Household Income
Median Household Income Comparison
Poles
Immigrants from Turkey
$88,472
MEDIAN HOUSEHOLD INCOME
89.7/ 100
METRIC RATING
136th/ 347
METRIC RANK
$96,964
MEDIAN HOUSEHOLD INCOME
100.0/ 100
METRIC RATING
41st/ 347
METRIC RANK
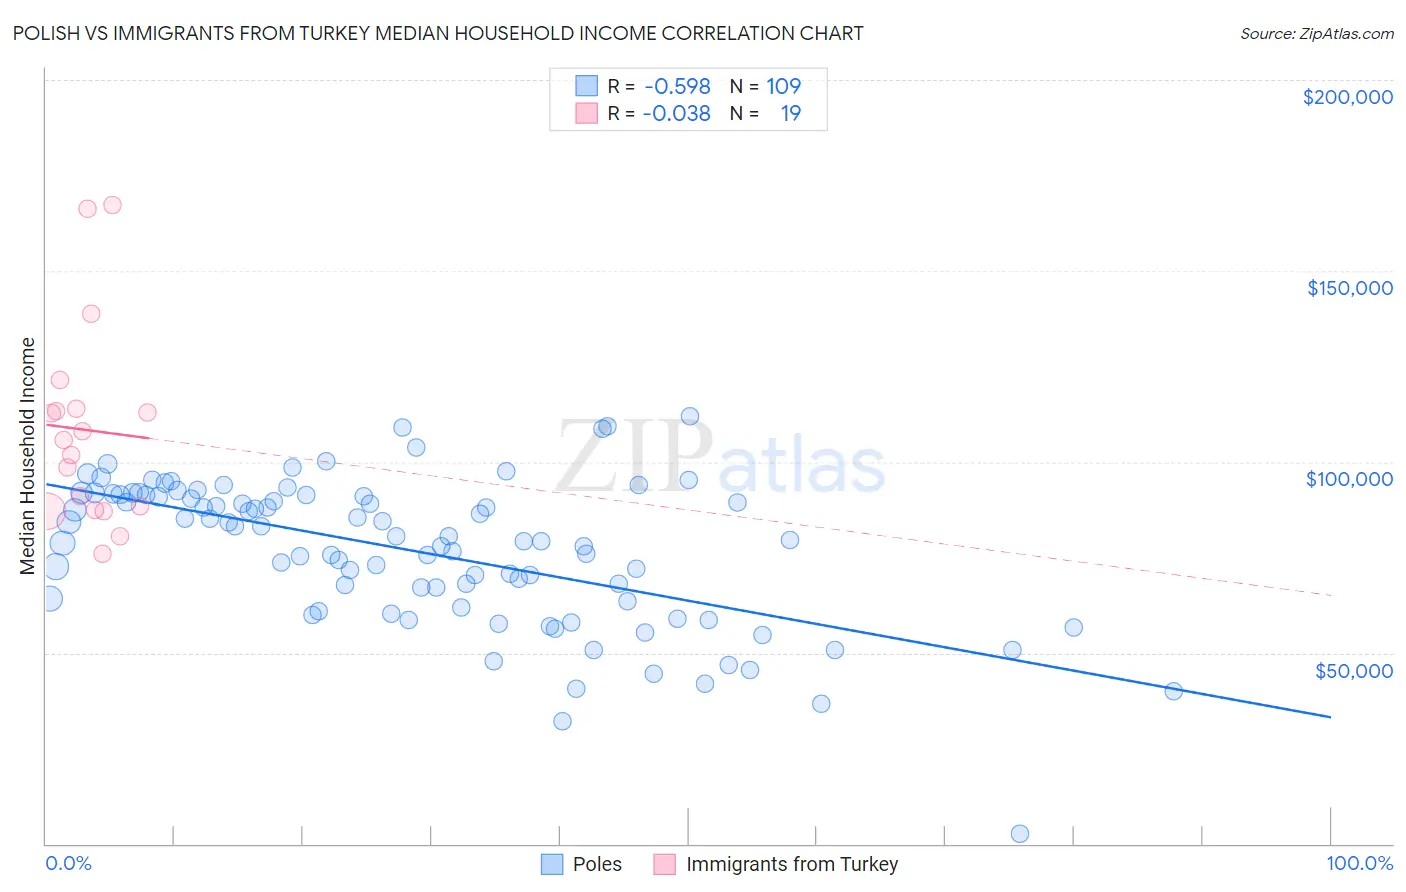
Polish vs Immigrants from Turkey Median Household Income Correlation Chart
The statistical analysis conducted on geographies consisting of 559,571,407 people shows a substantial negative correlation between the proportion of Poles and median household income in the United States with a correlation coefficient (R) of -0.598 and weighted average of $88,472. Similarly, the statistical analysis conducted on geographies consisting of 222,938,856 people shows no correlation between the proportion of Immigrants from Turkey and median household income in the United States with a correlation coefficient (R) of -0.038 and weighted average of $96,964, a difference of 9.6%.
Median Household Income Correlation Summary
| Measurement | Polish | Immigrants from Turkey |
| Minimum | $2,499 | $75,893 |
| Maximum | $112,083 | $167,317 |
| Range | $109,584 | $91,424 |
| Mean | $76,577 | $108,335 |
| Median | $79,444 | $105,608 |
| Interquartile 25% (IQ1) | $62,696 | $87,245 |
| Interquartile 75% (IQ3) | $91,347 | $113,867 |
| Interquartile Range (IQR) | $28,651 | $26,622 |
| Standard Deviation (Sample) | $19,210 | $25,883 |
| Standard Deviation (Population) | $19,121 | $25,193 |
Similar Demographics by Median Household Income
Demographics Similar to Poles by Median Household Income
In terms of median household income, the demographic groups most similar to Poles are Sierra Leonean ($88,463, a difference of 0.010%), Immigrants from Sierra Leone ($88,498, a difference of 0.030%), Swedish ($88,524, a difference of 0.060%), Arab ($88,398, a difference of 0.080%), and Immigrants from Chile ($88,388, a difference of 0.090%).
| Demographics | Rating | Rank | Median Household Income |
| Brazilians | 92.1 /100 | #129 | Exceptional $88,934 |
| British | 92.0 /100 | #130 | Exceptional $88,914 |
| Immigrants | Syria | 91.4 /100 | #131 | Exceptional $88,792 |
| Europeans | 91.2 /100 | #132 | Exceptional $88,751 |
| Immigrants | Ethiopia | 90.9 /100 | #133 | Exceptional $88,687 |
| Swedes | 90.0 /100 | #134 | Exceptional $88,524 |
| Immigrants | Sierra Leone | 89.9 /100 | #135 | Excellent $88,498 |
| Poles | 89.7 /100 | #136 | Excellent $88,472 |
| Sierra Leoneans | 89.6 /100 | #137 | Excellent $88,463 |
| Arabs | 89.2 /100 | #138 | Excellent $88,398 |
| Immigrants | Chile | 89.2 /100 | #139 | Excellent $88,388 |
| Lebanese | 87.2 /100 | #140 | Excellent $88,091 |
| Immigrants | Morocco | 86.0 /100 | #141 | Excellent $87,930 |
| Canadians | 84.7 /100 | #142 | Excellent $87,769 |
| Danes | 83.9 /100 | #143 | Excellent $87,676 |
Demographics Similar to Immigrants from Turkey by Median Household Income
In terms of median household income, the demographic groups most similar to Immigrants from Turkey are Maltese ($97,015, a difference of 0.050%), Afghan ($97,026, a difference of 0.060%), Immigrants from Lithuania ($96,836, a difference of 0.13%), Immigrants from France ($96,743, a difference of 0.23%), and Immigrants from Greece ($96,675, a difference of 0.30%).
| Demographics | Rating | Rank | Median Household Income |
| Russians | 100.0 /100 | #34 | Exceptional $98,008 |
| Immigrants | Switzerland | 100.0 /100 | #35 | Exceptional $97,979 |
| Immigrants | Pakistan | 100.0 /100 | #36 | Exceptional $97,528 |
| Latvians | 100.0 /100 | #37 | Exceptional $97,311 |
| Immigrants | Indonesia | 100.0 /100 | #38 | Exceptional $97,297 |
| Afghans | 100.0 /100 | #39 | Exceptional $97,026 |
| Maltese | 100.0 /100 | #40 | Exceptional $97,015 |
| Immigrants | Turkey | 100.0 /100 | #41 | Exceptional $96,964 |
| Immigrants | Lithuania | 99.9 /100 | #42 | Exceptional $96,836 |
| Immigrants | France | 99.9 /100 | #43 | Exceptional $96,743 |
| Immigrants | Greece | 99.9 /100 | #44 | Exceptional $96,675 |
| Israelis | 99.9 /100 | #45 | Exceptional $96,552 |
| Australians | 99.9 /100 | #46 | Exceptional $96,490 |
| Immigrants | Russia | 99.9 /100 | #47 | Exceptional $96,378 |
| Cambodians | 99.9 /100 | #48 | Exceptional $96,324 |