Armenian vs Hawaiian Median Male Earnings
COMPARE
Armenian
Hawaiian
Median Male Earnings
Median Male Earnings Comparison
Armenians
Hawaiians
$58,134
MEDIAN MALE EARNINGS
97.3/ 100
METRIC RATING
104th/ 347
METRIC RANK
$50,488
MEDIAN MALE EARNINGS
1.9/ 100
METRIC RATING
245th/ 347
METRIC RANK
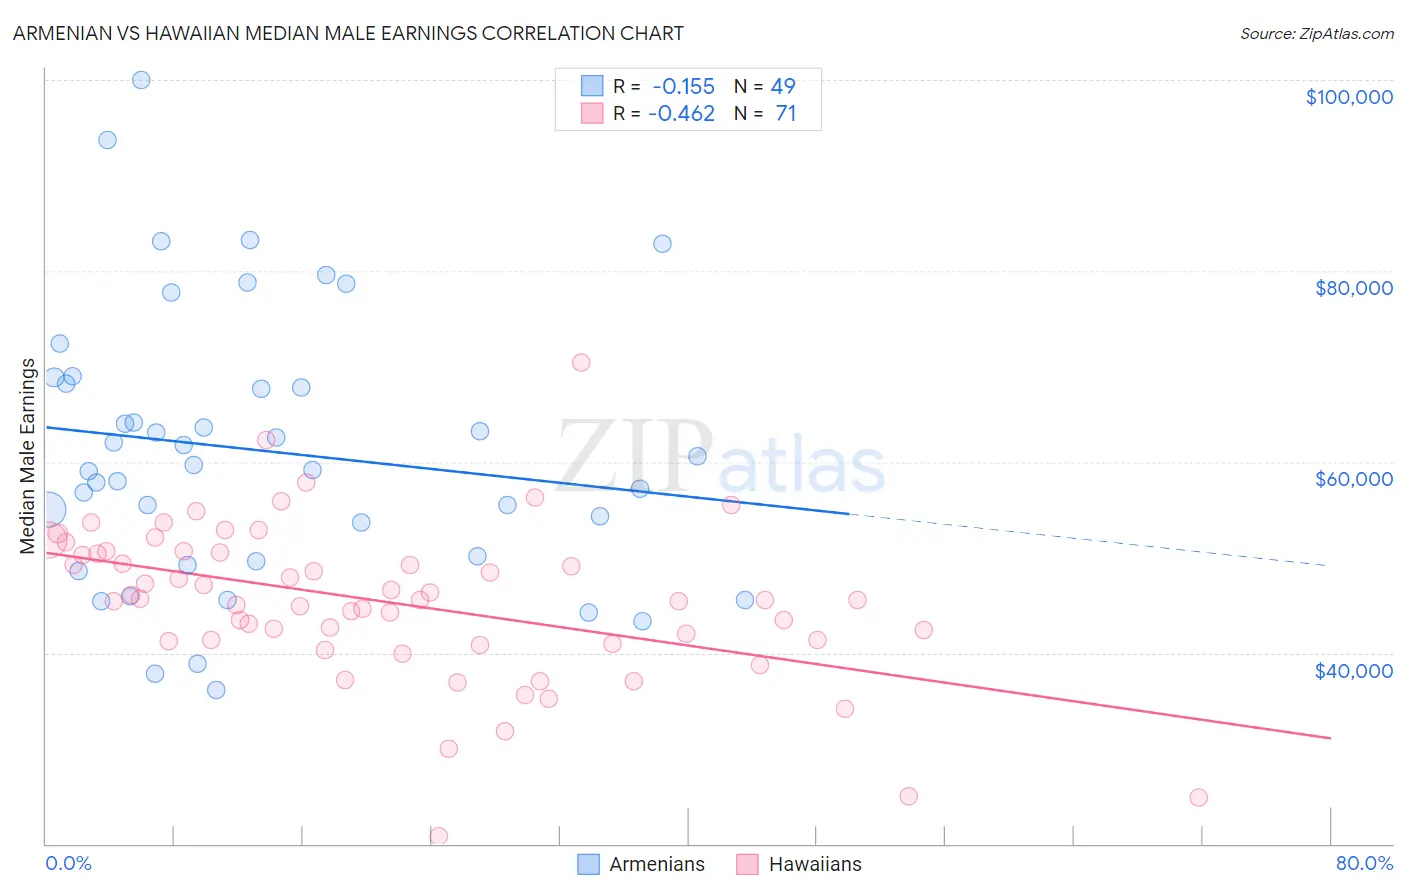
Armenian vs Hawaiian Median Male Earnings Correlation Chart
The statistical analysis conducted on geographies consisting of 310,896,747 people shows a poor negative correlation between the proportion of Armenians and median male earnings in the United States with a correlation coefficient (R) of -0.155 and weighted average of $58,134. Similarly, the statistical analysis conducted on geographies consisting of 327,518,939 people shows a moderate negative correlation between the proportion of Hawaiians and median male earnings in the United States with a correlation coefficient (R) of -0.462 and weighted average of $50,488, a difference of 15.1%.
Median Male Earnings Correlation Summary
| Measurement | Armenian | Hawaiian |
| Minimum | $36,151 | $20,774 |
| Maximum | $99,997 | $70,362 |
| Range | $63,846 | $49,588 |
| Mean | $61,183 | $45,275 |
| Median | $59,670 | $45,568 |
| Interquartile 25% (IQ1) | $49,867 | $41,232 |
| Interquartile 75% (IQ3) | $68,550 | $50,512 |
| Interquartile Range (IQR) | $18,683 | $9,280 |
| Standard Deviation (Sample) | $14,235 | $8,332 |
| Standard Deviation (Population) | $14,089 | $8,273 |
Similar Demographics by Median Male Earnings
Demographics Similar to Armenians by Median Male Earnings
In terms of median male earnings, the demographic groups most similar to Armenians are Polish ($58,139, a difference of 0.010%), Immigrants from Western Asia ($58,131, a difference of 0.010%), Syrian ($58,187, a difference of 0.090%), Immigrants from Northern Africa ($58,008, a difference of 0.22%), and Serbian ($57,975, a difference of 0.27%).
| Demographics | Rating | Rank | Median Male Earnings |
| Northern Europeans | 98.2 /100 | #97 | Exceptional $58,588 |
| Jordanians | 98.1 /100 | #98 | Exceptional $58,500 |
| Immigrants | Poland | 98.0 /100 | #99 | Exceptional $58,452 |
| Assyrians/Chaldeans/Syriacs | 97.9 /100 | #100 | Exceptional $58,437 |
| Immigrants | Brazil | 97.7 /100 | #101 | Exceptional $58,324 |
| Syrians | 97.4 /100 | #102 | Exceptional $58,187 |
| Poles | 97.3 /100 | #103 | Exceptional $58,139 |
| Armenians | 97.3 /100 | #104 | Exceptional $58,134 |
| Immigrants | Western Asia | 97.3 /100 | #105 | Exceptional $58,131 |
| Immigrants | Northern Africa | 96.9 /100 | #106 | Exceptional $58,008 |
| Serbians | 96.8 /100 | #107 | Exceptional $57,975 |
| Immigrants | Uzbekistan | 96.7 /100 | #108 | Exceptional $57,941 |
| British | 96.5 /100 | #109 | Exceptional $57,890 |
| Palestinians | 96.2 /100 | #110 | Exceptional $57,778 |
| Europeans | 95.6 /100 | #111 | Exceptional $57,637 |
Demographics Similar to Hawaiians by Median Male Earnings
In terms of median male earnings, the demographic groups most similar to Hawaiians are Immigrants from Ecuador ($50,474, a difference of 0.030%), Houma ($50,547, a difference of 0.12%), Subsaharan African ($50,408, a difference of 0.16%), French American Indian ($50,611, a difference of 0.24%), and Guyanese ($50,613, a difference of 0.25%).
| Demographics | Rating | Rank | Median Male Earnings |
| Malaysians | 2.5 /100 | #238 | Tragic $50,772 |
| Americans | 2.5 /100 | #239 | Tragic $50,761 |
| West Indians | 2.3 /100 | #240 | Tragic $50,682 |
| Immigrants | St. Vincent and the Grenadines | 2.3 /100 | #241 | Tragic $50,665 |
| Guyanese | 2.2 /100 | #242 | Tragic $50,613 |
| French American Indians | 2.2 /100 | #243 | Tragic $50,611 |
| Houma | 2.0 /100 | #244 | Tragic $50,547 |
| Hawaiians | 1.9 /100 | #245 | Tragic $50,488 |
| Immigrants | Ecuador | 1.9 /100 | #246 | Tragic $50,474 |
| Sub-Saharan Africans | 1.8 /100 | #247 | Tragic $50,408 |
| Immigrants | Guyana | 1.6 /100 | #248 | Tragic $50,321 |
| Immigrants | Burma/Myanmar | 1.6 /100 | #249 | Tragic $50,298 |
| Osage | 1.6 /100 | #250 | Tragic $50,292 |
| Immigrants | Grenada | 1.6 /100 | #251 | Tragic $50,279 |
| Immigrants | Cabo Verde | 1.2 /100 | #252 | Tragic $50,009 |