Armenian vs Immigrants from Croatia Median Male Earnings
COMPARE
Armenian
Immigrants from Croatia
Median Male Earnings
Median Male Earnings Comparison
Armenians
Immigrants from Croatia
$58,134
MEDIAN MALE EARNINGS
97.3/ 100
METRIC RATING
104th/ 347
METRIC RANK
$60,914
MEDIAN MALE EARNINGS
99.8/ 100
METRIC RATING
66th/ 347
METRIC RANK
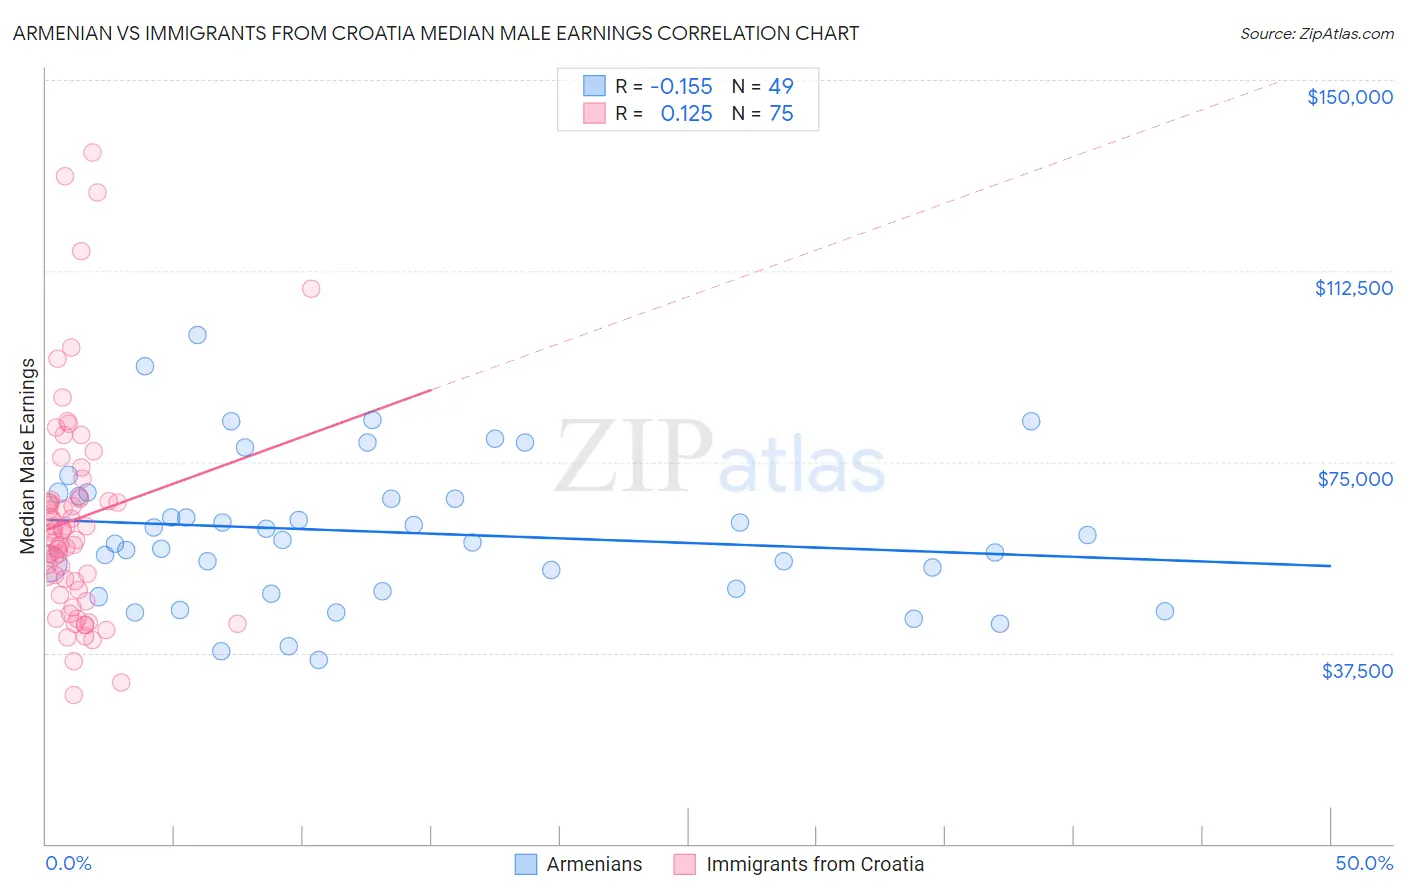
Armenian vs Immigrants from Croatia Median Male Earnings Correlation Chart
The statistical analysis conducted on geographies consisting of 310,896,747 people shows a poor negative correlation between the proportion of Armenians and median male earnings in the United States with a correlation coefficient (R) of -0.155 and weighted average of $58,134. Similarly, the statistical analysis conducted on geographies consisting of 132,568,017 people shows a poor positive correlation between the proportion of Immigrants from Croatia and median male earnings in the United States with a correlation coefficient (R) of 0.125 and weighted average of $60,914, a difference of 4.8%.
Median Male Earnings Correlation Summary
| Measurement | Armenian | Immigrants from Croatia |
| Minimum | $36,151 | $29,220 |
| Maximum | $99,997 | $135,716 |
| Range | $63,846 | $106,496 |
| Mean | $61,183 | $63,717 |
| Median | $59,670 | $61,084 |
| Interquartile 25% (IQ1) | $49,867 | $49,929 |
| Interquartile 75% (IQ3) | $68,550 | $67,721 |
| Interquartile Range (IQR) | $18,683 | $17,792 |
| Standard Deviation (Sample) | $14,235 | $21,463 |
| Standard Deviation (Population) | $14,089 | $21,320 |
Similar Demographics by Median Male Earnings
Demographics Similar to Armenians by Median Male Earnings
In terms of median male earnings, the demographic groups most similar to Armenians are Polish ($58,139, a difference of 0.010%), Immigrants from Western Asia ($58,131, a difference of 0.010%), Syrian ($58,187, a difference of 0.090%), Immigrants from Northern Africa ($58,008, a difference of 0.22%), and Serbian ($57,975, a difference of 0.27%).
| Demographics | Rating | Rank | Median Male Earnings |
| Northern Europeans | 98.2 /100 | #97 | Exceptional $58,588 |
| Jordanians | 98.1 /100 | #98 | Exceptional $58,500 |
| Immigrants | Poland | 98.0 /100 | #99 | Exceptional $58,452 |
| Assyrians/Chaldeans/Syriacs | 97.9 /100 | #100 | Exceptional $58,437 |
| Immigrants | Brazil | 97.7 /100 | #101 | Exceptional $58,324 |
| Syrians | 97.4 /100 | #102 | Exceptional $58,187 |
| Poles | 97.3 /100 | #103 | Exceptional $58,139 |
| Armenians | 97.3 /100 | #104 | Exceptional $58,134 |
| Immigrants | Western Asia | 97.3 /100 | #105 | Exceptional $58,131 |
| Immigrants | Northern Africa | 96.9 /100 | #106 | Exceptional $58,008 |
| Serbians | 96.8 /100 | #107 | Exceptional $57,975 |
| Immigrants | Uzbekistan | 96.7 /100 | #108 | Exceptional $57,941 |
| British | 96.5 /100 | #109 | Exceptional $57,890 |
| Palestinians | 96.2 /100 | #110 | Exceptional $57,778 |
| Europeans | 95.6 /100 | #111 | Exceptional $57,637 |
Demographics Similar to Immigrants from Croatia by Median Male Earnings
In terms of median male earnings, the demographic groups most similar to Immigrants from Croatia are Immigrants from Indonesia ($60,935, a difference of 0.030%), Immigrants from Eastern Europe ($60,958, a difference of 0.070%), Immigrants from Pakistan ($60,987, a difference of 0.12%), Immigrants from Romania ($61,040, a difference of 0.21%), and Bolivian ($61,066, a difference of 0.25%).
| Demographics | Rating | Rank | Median Male Earnings |
| Immigrants | Netherlands | 99.8 /100 | #59 | Exceptional $61,096 |
| Egyptians | 99.8 /100 | #60 | Exceptional $61,095 |
| Bolivians | 99.8 /100 | #61 | Exceptional $61,066 |
| Immigrants | Romania | 99.8 /100 | #62 | Exceptional $61,040 |
| Immigrants | Pakistan | 99.8 /100 | #63 | Exceptional $60,987 |
| Immigrants | Eastern Europe | 99.8 /100 | #64 | Exceptional $60,958 |
| Immigrants | Indonesia | 99.8 /100 | #65 | Exceptional $60,935 |
| Immigrants | Croatia | 99.8 /100 | #66 | Exceptional $60,914 |
| Immigrants | Spain | 99.8 /100 | #67 | Exceptional $60,750 |
| Immigrants | Serbia | 99.7 /100 | #68 | Exceptional $60,600 |
| Immigrants | Canada | 99.7 /100 | #69 | Exceptional $60,388 |
| Immigrants | Bulgaria | 99.7 /100 | #70 | Exceptional $60,358 |
| Mongolians | 99.7 /100 | #71 | Exceptional $60,350 |
| Immigrants | Western Europe | 99.7 /100 | #72 | Exceptional $60,334 |
| Immigrants | North America | 99.7 /100 | #73 | Exceptional $60,265 |