Arab vs British West Indian Median Female Earnings
COMPARE
Arab
British West Indian
Median Female Earnings
Median Female Earnings Comparison
Arabs
British West Indians
$40,718
MEDIAN FEMALE EARNINGS
89.3/ 100
METRIC RATING
134th/ 347
METRIC RANK
$40,299
MEDIAN FEMALE EARNINGS
77.7/ 100
METRIC RATING
153rd/ 347
METRIC RANK
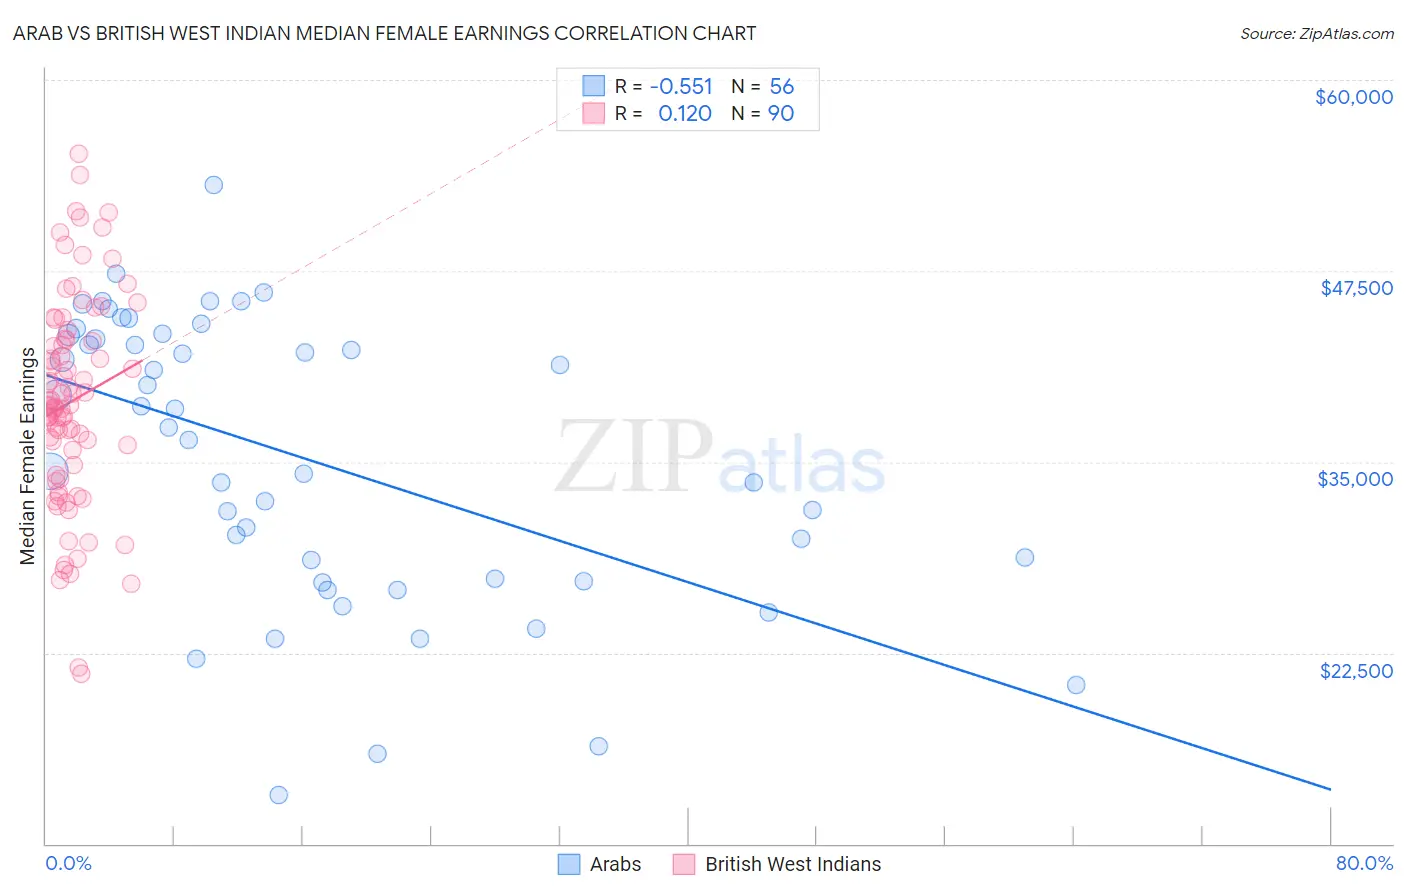
Arab vs British West Indian Median Female Earnings Correlation Chart
The statistical analysis conducted on geographies consisting of 486,538,152 people shows a substantial negative correlation between the proportion of Arabs and median female earnings in the United States with a correlation coefficient (R) of -0.551 and weighted average of $40,718. Similarly, the statistical analysis conducted on geographies consisting of 152,687,488 people shows a poor positive correlation between the proportion of British West Indians and median female earnings in the United States with a correlation coefficient (R) of 0.120 and weighted average of $40,299, a difference of 1.0%.
Median Female Earnings Correlation Summary
| Measurement | Arab | British West Indian |
| Minimum | $13,173 | $21,143 |
| Maximum | $53,122 | $55,209 |
| Range | $39,949 | $34,066 |
| Mean | $35,183 | $38,959 |
| Median | $36,815 | $38,706 |
| Interquartile 25% (IQ1) | $27,287 | $34,766 |
| Interquartile 75% (IQ3) | $43,150 | $42,968 |
| Interquartile Range (IQR) | $15,863 | $8,202 |
| Standard Deviation (Sample) | $9,334 | $6,842 |
| Standard Deviation (Population) | $9,250 | $6,804 |
Demographics Similar to Arabs and British West Indians by Median Female Earnings
In terms of median female earnings, the demographic groups most similar to Arabs are Syrian ($40,727, a difference of 0.020%), Immigrants from Nepal ($40,704, a difference of 0.030%), Immigrants from Eastern Africa ($40,644, a difference of 0.18%), Pakistani ($40,596, a difference of 0.30%), and Taiwanese ($40,576, a difference of 0.35%). Similarly, the demographic groups most similar to British West Indians are West Indian ($40,317, a difference of 0.040%), Immigrants from Armenia ($40,340, a difference of 0.10%), Immigrants from Chile ($40,353, a difference of 0.13%), Immigrants from Cameroon ($40,354, a difference of 0.14%), and Polish ($40,371, a difference of 0.18%).
| Demographics | Rating | Rank | Median Female Earnings |
| Syrians | 89.5 /100 | #133 | Excellent $40,727 |
| Arabs | 89.3 /100 | #134 | Excellent $40,718 |
| Immigrants | Nepal | 89.0 /100 | #135 | Excellent $40,704 |
| Immigrants | Eastern Africa | 87.7 /100 | #136 | Excellent $40,644 |
| Pakistanis | 86.6 /100 | #137 | Excellent $40,596 |
| Taiwanese | 86.1 /100 | #138 | Excellent $40,576 |
| Immigrants | South Eastern Asia | 85.7 /100 | #139 | Excellent $40,558 |
| Serbians | 85.2 /100 | #140 | Excellent $40,539 |
| Immigrants | Syria | 84.1 /100 | #141 | Excellent $40,499 |
| Sri Lankans | 84.0 /100 | #142 | Excellent $40,496 |
| Northern Europeans | 83.9 /100 | #143 | Excellent $40,491 |
| Immigrants | North Macedonia | 83.8 /100 | #144 | Excellent $40,488 |
| Brazilians | 83.6 /100 | #145 | Excellent $40,483 |
| Ghanaians | 82.1 /100 | #146 | Excellent $40,429 |
| Vietnamese | 80.4 /100 | #147 | Excellent $40,377 |
| Poles | 80.2 /100 | #148 | Excellent $40,371 |
| Immigrants | Cameroon | 79.7 /100 | #149 | Good $40,354 |
| Immigrants | Chile | 79.6 /100 | #150 | Good $40,353 |
| Immigrants | Armenia | 79.2 /100 | #151 | Good $40,340 |
| West Indians | 78.4 /100 | #152 | Good $40,317 |
| British West Indians | 77.7 /100 | #153 | Good $40,299 |