Arab vs Immigrants from Middle Africa Median Female Earnings
COMPARE
Arab
Immigrants from Middle Africa
Median Female Earnings
Median Female Earnings Comparison
Arabs
Immigrants from Middle Africa
$40,718
MEDIAN FEMALE EARNINGS
89.3/ 100
METRIC RATING
134th/ 347
METRIC RANK
$37,965
MEDIAN FEMALE EARNINGS
2.7/ 100
METRIC RATING
245th/ 347
METRIC RANK
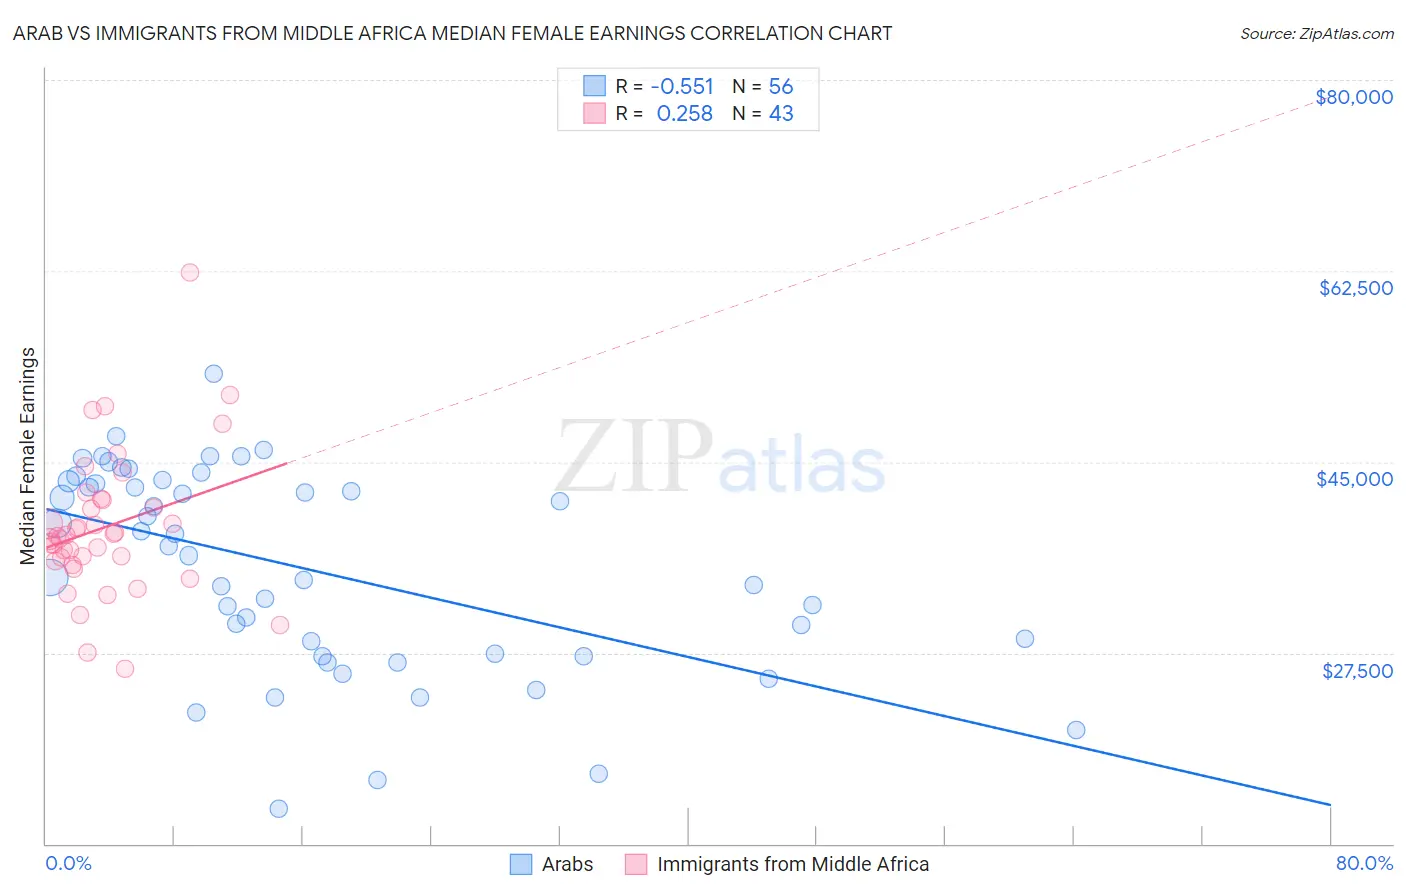
Arab vs Immigrants from Middle Africa Median Female Earnings Correlation Chart
The statistical analysis conducted on geographies consisting of 486,538,152 people shows a substantial negative correlation between the proportion of Arabs and median female earnings in the United States with a correlation coefficient (R) of -0.551 and weighted average of $40,718. Similarly, the statistical analysis conducted on geographies consisting of 202,702,716 people shows a weak positive correlation between the proportion of Immigrants from Middle Africa and median female earnings in the United States with a correlation coefficient (R) of 0.258 and weighted average of $37,965, a difference of 7.2%.
Median Female Earnings Correlation Summary
| Measurement | Arab | Immigrants from Middle Africa |
| Minimum | $13,173 | $26,014 |
| Maximum | $53,122 | $62,334 |
| Range | $39,949 | $36,320 |
| Mean | $35,183 | $39,010 |
| Median | $36,815 | $38,230 |
| Interquartile 25% (IQ1) | $27,287 | $35,893 |
| Interquartile 75% (IQ3) | $43,150 | $41,514 |
| Interquartile Range (IQR) | $15,863 | $5,621 |
| Standard Deviation (Sample) | $9,334 | $6,561 |
| Standard Deviation (Population) | $9,250 | $6,484 |
Similar Demographics by Median Female Earnings
Demographics Similar to Arabs by Median Female Earnings
In terms of median female earnings, the demographic groups most similar to Arabs are Syrian ($40,727, a difference of 0.020%), Immigrants from Nepal ($40,704, a difference of 0.030%), Immigrants from Uganda ($40,739, a difference of 0.050%), Chilean ($40,757, a difference of 0.10%), and Immigrants from Guyana ($40,773, a difference of 0.14%).
| Demographics | Rating | Rank | Median Female Earnings |
| Ugandans | 92.2 /100 | #127 | Exceptional $40,889 |
| Carpatho Rusyns | 91.2 /100 | #128 | Exceptional $40,825 |
| Zimbabweans | 90.8 /100 | #129 | Exceptional $40,798 |
| Immigrants | Guyana | 90.3 /100 | #130 | Exceptional $40,773 |
| Chileans | 90.0 /100 | #131 | Exceptional $40,757 |
| Immigrants | Uganda | 89.7 /100 | #132 | Excellent $40,739 |
| Syrians | 89.5 /100 | #133 | Excellent $40,727 |
| Arabs | 89.3 /100 | #134 | Excellent $40,718 |
| Immigrants | Nepal | 89.0 /100 | #135 | Excellent $40,704 |
| Immigrants | Eastern Africa | 87.7 /100 | #136 | Excellent $40,644 |
| Pakistanis | 86.6 /100 | #137 | Excellent $40,596 |
| Taiwanese | 86.1 /100 | #138 | Excellent $40,576 |
| Immigrants | South Eastern Asia | 85.7 /100 | #139 | Excellent $40,558 |
| Serbians | 85.2 /100 | #140 | Excellent $40,539 |
| Immigrants | Syria | 84.1 /100 | #141 | Excellent $40,499 |
Demographics Similar to Immigrants from Middle Africa by Median Female Earnings
In terms of median female earnings, the demographic groups most similar to Immigrants from Middle Africa are Delaware ($37,964, a difference of 0.0%), Immigrants from Liberia ($37,970, a difference of 0.010%), German ($37,986, a difference of 0.050%), Immigrants from Somalia ($37,914, a difference of 0.14%), and Alaskan Athabascan ($37,905, a difference of 0.16%).
| Demographics | Rating | Rank | Median Female Earnings |
| Alaska Natives | 4.3 /100 | #238 | Tragic $38,202 |
| English | 4.2 /100 | #239 | Tragic $38,196 |
| Finns | 4.0 /100 | #240 | Tragic $38,173 |
| Spanish | 3.5 /100 | #241 | Tragic $38,098 |
| Immigrants | Burma/Myanmar | 3.0 /100 | #242 | Tragic $38,028 |
| Germans | 2.8 /100 | #243 | Tragic $37,986 |
| Immigrants | Liberia | 2.7 /100 | #244 | Tragic $37,970 |
| Immigrants | Middle Africa | 2.7 /100 | #245 | Tragic $37,965 |
| Delaware | 2.6 /100 | #246 | Tragic $37,964 |
| Immigrants | Somalia | 2.4 /100 | #247 | Tragic $37,914 |
| Alaskan Athabascans | 2.3 /100 | #248 | Tragic $37,905 |
| Swiss | 2.3 /100 | #249 | Tragic $37,904 |
| Immigrants | Iraq | 2.2 /100 | #250 | Tragic $37,864 |
| Welsh | 2.1 /100 | #251 | Tragic $37,856 |
| Immigrants | Dominica | 2.0 /100 | #252 | Tragic $37,825 |