Immigrants from the Azores vs Immigrants from Fiji Median Female Earnings
COMPARE
Immigrants from the Azores
Immigrants from Fiji
Median Female Earnings
Median Female Earnings Comparison
Immigrants from the Azores
Immigrants from Fiji
$38,573
MEDIAN FEMALE EARNINGS
8.8/ 100
METRIC RATING
221st/ 347
METRIC RANK
$41,656
MEDIAN FEMALE EARNINGS
98.3/ 100
METRIC RATING
101st/ 347
METRIC RANK
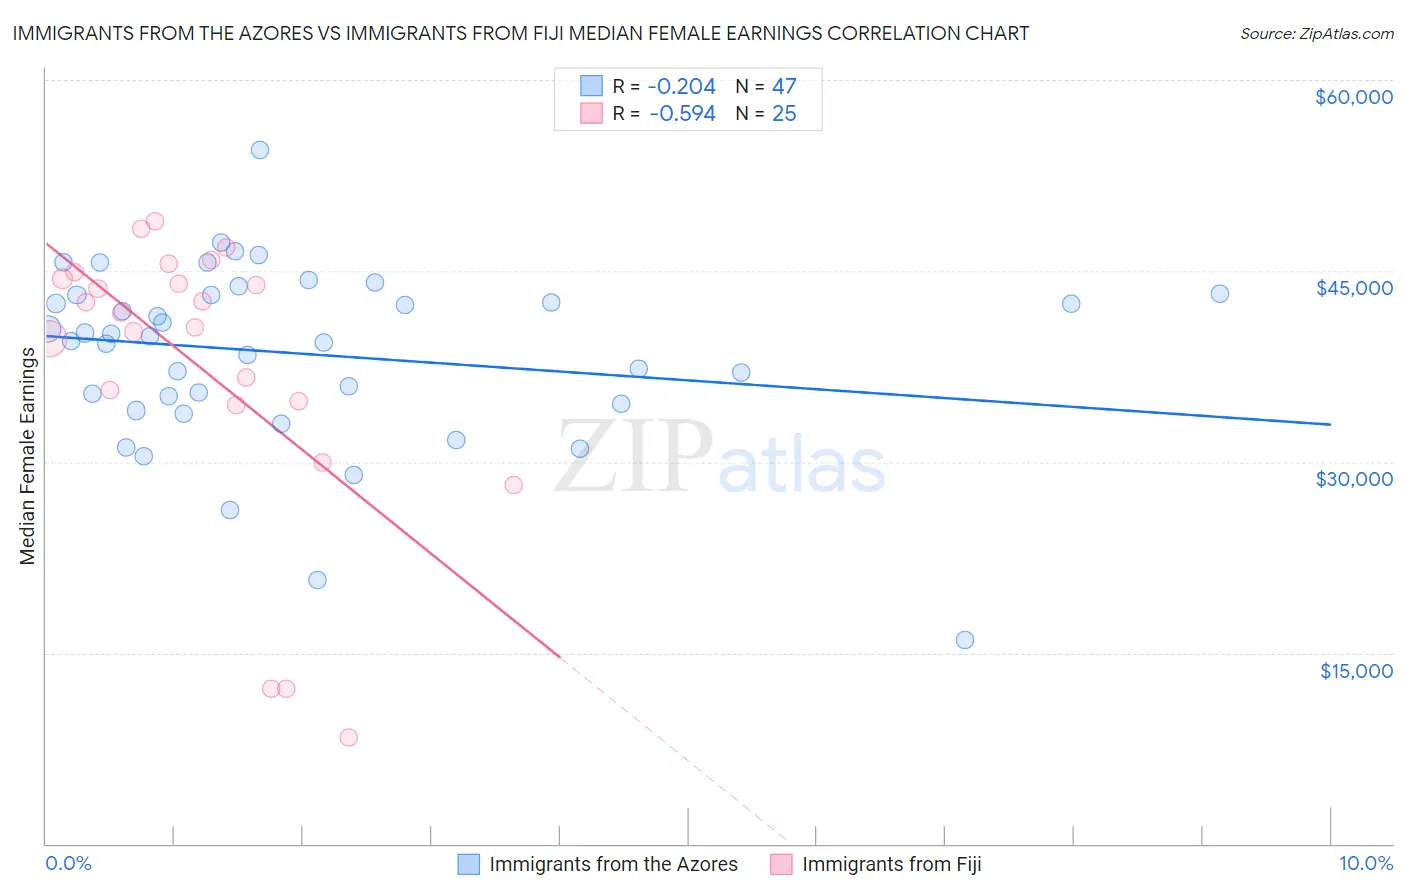
Immigrants from the Azores vs Immigrants from Fiji Median Female Earnings Correlation Chart
The statistical analysis conducted on geographies consisting of 46,252,710 people shows a weak negative correlation between the proportion of Immigrants from the Azores and median female earnings in the United States with a correlation coefficient (R) of -0.204 and weighted average of $38,573. Similarly, the statistical analysis conducted on geographies consisting of 93,750,474 people shows a substantial negative correlation between the proportion of Immigrants from Fiji and median female earnings in the United States with a correlation coefficient (R) of -0.594 and weighted average of $41,656, a difference of 8.0%.
Median Female Earnings Correlation Summary
| Measurement | Immigrants from the Azores | Immigrants from Fiji |
| Minimum | $15,996 | $8,380 |
| Maximum | $54,521 | $48,941 |
| Range | $38,525 | $40,561 |
| Mean | $38,490 | $37,439 |
| Median | $39,828 | $41,723 |
| Interquartile 25% (IQ1) | $34,594 | $34,596 |
| Interquartile 75% (IQ3) | $43,084 | $44,642 |
| Interquartile Range (IQR) | $8,490 | $10,046 |
| Standard Deviation (Sample) | $7,045 | $11,332 |
| Standard Deviation (Population) | $6,970 | $11,103 |
Similar Demographics by Median Female Earnings
Demographics Similar to Immigrants from the Azores by Median Female Earnings
In terms of median female earnings, the demographic groups most similar to Immigrants from the Azores are Yugoslavian ($38,573, a difference of 0.0%), Nepalese ($38,603, a difference of 0.080%), Cape Verdean ($38,614, a difference of 0.11%), Japanese ($38,528, a difference of 0.12%), and Immigrants from Jamaica ($38,625, a difference of 0.14%).
| Demographics | Rating | Rank | Median Female Earnings |
| Iraqis | 10.5 /100 | #214 | Poor $38,666 |
| Spaniards | 10.3 /100 | #215 | Poor $38,656 |
| Immigrants | Ecuador | 10.1 /100 | #216 | Poor $38,644 |
| Immigrants | Jamaica | 9.7 /100 | #217 | Tragic $38,625 |
| Cape Verdeans | 9.5 /100 | #218 | Tragic $38,614 |
| Nepalese | 9.3 /100 | #219 | Tragic $38,603 |
| Yugoslavians | 8.8 /100 | #220 | Tragic $38,573 |
| Immigrants | Azores | 8.8 /100 | #221 | Tragic $38,573 |
| Japanese | 8.1 /100 | #222 | Tragic $38,528 |
| Immigrants | Sudan | 7.8 /100 | #223 | Tragic $38,511 |
| Native Hawaiians | 7.1 /100 | #224 | Tragic $38,461 |
| French | 7.0 /100 | #225 | Tragic $38,457 |
| French Canadians | 6.8 /100 | #226 | Tragic $38,436 |
| Scottish | 6.3 /100 | #227 | Tragic $38,397 |
| Sub-Saharan Africans | 6.2 /100 | #228 | Tragic $38,391 |
Demographics Similar to Immigrants from Fiji by Median Female Earnings
In terms of median female earnings, the demographic groups most similar to Immigrants from Fiji are Romanian ($41,663, a difference of 0.020%), Immigrants from Poland ($41,630, a difference of 0.060%), Immigrants from Barbados ($41,685, a difference of 0.070%), Immigrants from Argentina ($41,554, a difference of 0.25%), and Immigrants from Scotland ($41,771, a difference of 0.28%).
| Demographics | Rating | Rank | Median Female Earnings |
| Moroccans | 98.9 /100 | #94 | Exceptional $41,872 |
| Immigrants | Netherlands | 98.9 /100 | #95 | Exceptional $41,870 |
| South Africans | 98.8 /100 | #96 | Exceptional $41,825 |
| Immigrants | Hungary | 98.8 /100 | #97 | Exceptional $41,820 |
| Immigrants | Scotland | 98.7 /100 | #98 | Exceptional $41,771 |
| Immigrants | Barbados | 98.4 /100 | #99 | Exceptional $41,685 |
| Romanians | 98.3 /100 | #100 | Exceptional $41,663 |
| Immigrants | Fiji | 98.3 /100 | #101 | Exceptional $41,656 |
| Immigrants | Poland | 98.2 /100 | #102 | Exceptional $41,630 |
| Immigrants | Argentina | 97.9 /100 | #103 | Exceptional $41,554 |
| Immigrants | Zimbabwe | 97.8 /100 | #104 | Exceptional $41,527 |
| Italians | 97.7 /100 | #105 | Exceptional $41,505 |
| Immigrants | Eritrea | 97.6 /100 | #106 | Exceptional $41,485 |
| Palestinians | 97.6 /100 | #107 | Exceptional $41,484 |
| Jordanians | 97.5 /100 | #108 | Exceptional $41,464 |