Immigrants from Bahamas vs Immigrants from Fiji Median Female Earnings
COMPARE
Immigrants from Bahamas
Immigrants from Fiji
Median Female Earnings
Median Female Earnings Comparison
Immigrants from Bahamas
Immigrants from Fiji
$35,027
MEDIAN FEMALE EARNINGS
0.0/ 100
METRIC RATING
308th/ 347
METRIC RANK
$41,656
MEDIAN FEMALE EARNINGS
98.3/ 100
METRIC RATING
101st/ 347
METRIC RANK
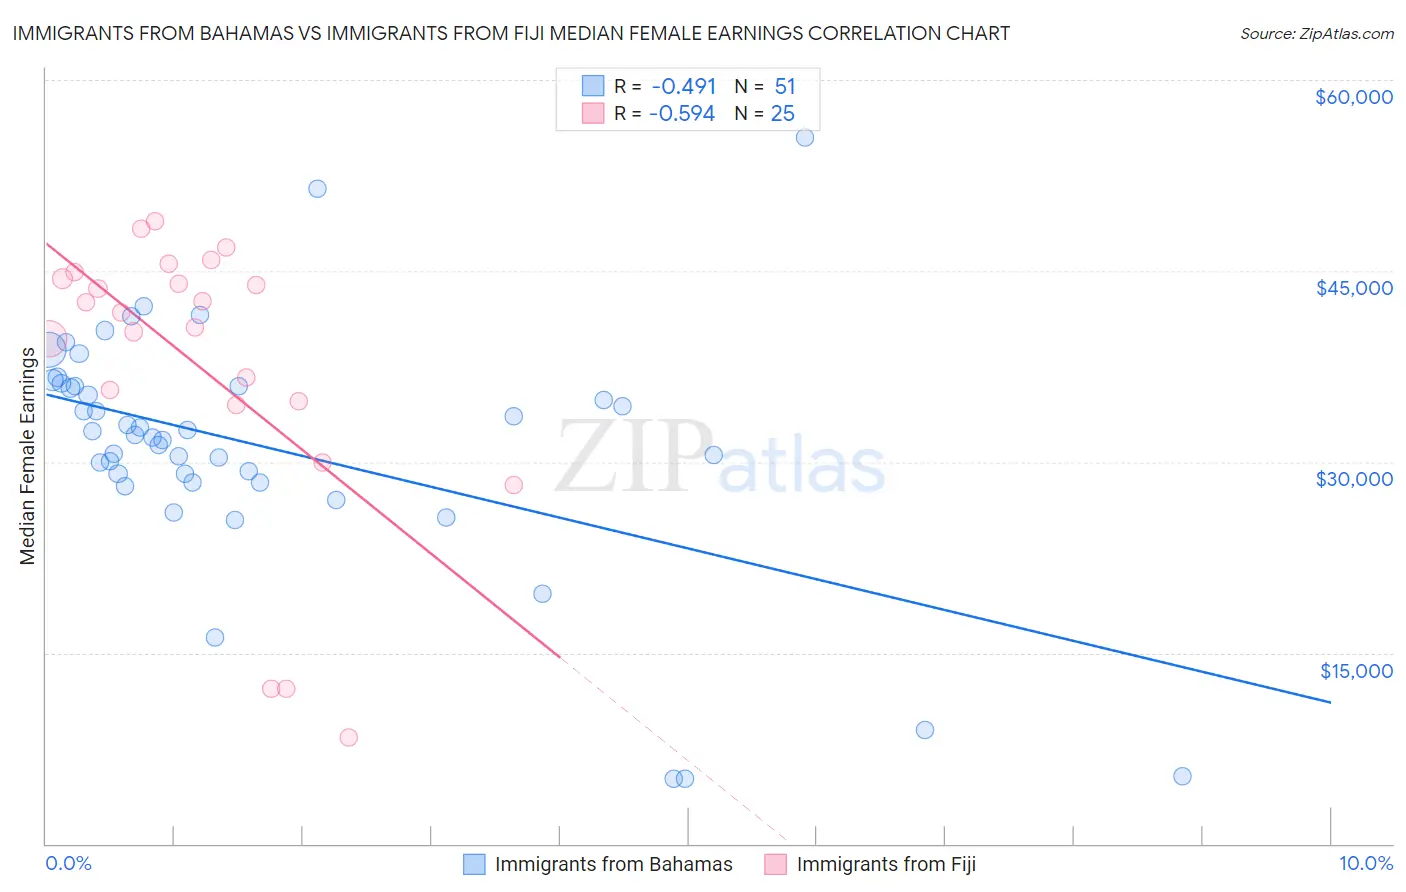
Immigrants from Bahamas vs Immigrants from Fiji Median Female Earnings Correlation Chart
The statistical analysis conducted on geographies consisting of 104,633,712 people shows a moderate negative correlation between the proportion of Immigrants from Bahamas and median female earnings in the United States with a correlation coefficient (R) of -0.491 and weighted average of $35,027. Similarly, the statistical analysis conducted on geographies consisting of 93,750,474 people shows a substantial negative correlation between the proportion of Immigrants from Fiji and median female earnings in the United States with a correlation coefficient (R) of -0.594 and weighted average of $41,656, a difference of 18.9%.
Median Female Earnings Correlation Summary
| Measurement | Immigrants from Bahamas | Immigrants from Fiji |
| Minimum | $5,063 | $8,380 |
| Maximum | $55,500 | $48,941 |
| Range | $50,437 | $40,561 |
| Mean | $31,145 | $37,439 |
| Median | $32,119 | $41,723 |
| Interquartile 25% (IQ1) | $28,361 | $34,596 |
| Interquartile 75% (IQ3) | $35,940 | $44,642 |
| Interquartile Range (IQR) | $7,579 | $10,046 |
| Standard Deviation (Sample) | $9,851 | $11,332 |
| Standard Deviation (Population) | $9,754 | $11,103 |
Similar Demographics by Median Female Earnings
Demographics Similar to Immigrants from Bahamas by Median Female Earnings
In terms of median female earnings, the demographic groups most similar to Immigrants from Bahamas are Honduran ($35,013, a difference of 0.040%), Chippewa ($35,003, a difference of 0.070%), Sioux ($35,063, a difference of 0.10%), Ute ($34,960, a difference of 0.19%), and Yaqui ($34,943, a difference of 0.24%).
| Demographics | Rating | Rank | Median Female Earnings |
| Pima | 0.0 /100 | #301 | Tragic $35,326 |
| Blacks/African Americans | 0.0 /100 | #302 | Tragic $35,315 |
| Immigrants | Latin America | 0.0 /100 | #303 | Tragic $35,307 |
| Crow | 0.0 /100 | #304 | Tragic $35,266 |
| Bahamians | 0.0 /100 | #305 | Tragic $35,125 |
| Fijians | 0.0 /100 | #306 | Tragic $35,114 |
| Sioux | 0.0 /100 | #307 | Tragic $35,063 |
| Immigrants | Bahamas | 0.0 /100 | #308 | Tragic $35,027 |
| Hondurans | 0.0 /100 | #309 | Tragic $35,013 |
| Chippewa | 0.0 /100 | #310 | Tragic $35,003 |
| Ute | 0.0 /100 | #311 | Tragic $34,960 |
| Yaqui | 0.0 /100 | #312 | Tragic $34,943 |
| Cubans | 0.0 /100 | #313 | Tragic $34,942 |
| Apache | 0.0 /100 | #314 | Tragic $34,895 |
| Pennsylvania Germans | 0.0 /100 | #315 | Tragic $34,802 |
Demographics Similar to Immigrants from Fiji by Median Female Earnings
In terms of median female earnings, the demographic groups most similar to Immigrants from Fiji are Romanian ($41,663, a difference of 0.020%), Immigrants from Poland ($41,630, a difference of 0.060%), Immigrants from Barbados ($41,685, a difference of 0.070%), Immigrants from Argentina ($41,554, a difference of 0.25%), and Immigrants from Scotland ($41,771, a difference of 0.28%).
| Demographics | Rating | Rank | Median Female Earnings |
| Moroccans | 98.9 /100 | #94 | Exceptional $41,872 |
| Immigrants | Netherlands | 98.9 /100 | #95 | Exceptional $41,870 |
| South Africans | 98.8 /100 | #96 | Exceptional $41,825 |
| Immigrants | Hungary | 98.8 /100 | #97 | Exceptional $41,820 |
| Immigrants | Scotland | 98.7 /100 | #98 | Exceptional $41,771 |
| Immigrants | Barbados | 98.4 /100 | #99 | Exceptional $41,685 |
| Romanians | 98.3 /100 | #100 | Exceptional $41,663 |
| Immigrants | Fiji | 98.3 /100 | #101 | Exceptional $41,656 |
| Immigrants | Poland | 98.2 /100 | #102 | Exceptional $41,630 |
| Immigrants | Argentina | 97.9 /100 | #103 | Exceptional $41,554 |
| Immigrants | Zimbabwe | 97.8 /100 | #104 | Exceptional $41,527 |
| Italians | 97.7 /100 | #105 | Exceptional $41,505 |
| Immigrants | Eritrea | 97.6 /100 | #106 | Exceptional $41,485 |
| Palestinians | 97.6 /100 | #107 | Exceptional $41,484 |
| Jordanians | 97.5 /100 | #108 | Exceptional $41,464 |