Korean vs Immigrants from Fiji Median Female Earnings
COMPARE
Korean
Immigrants from Fiji
Median Female Earnings
Median Female Earnings Comparison
Koreans
Immigrants from Fiji
$41,276
MEDIAN FEMALE EARNINGS
96.4/ 100
METRIC RATING
115th/ 347
METRIC RANK
$41,656
MEDIAN FEMALE EARNINGS
98.3/ 100
METRIC RATING
101st/ 347
METRIC RANK
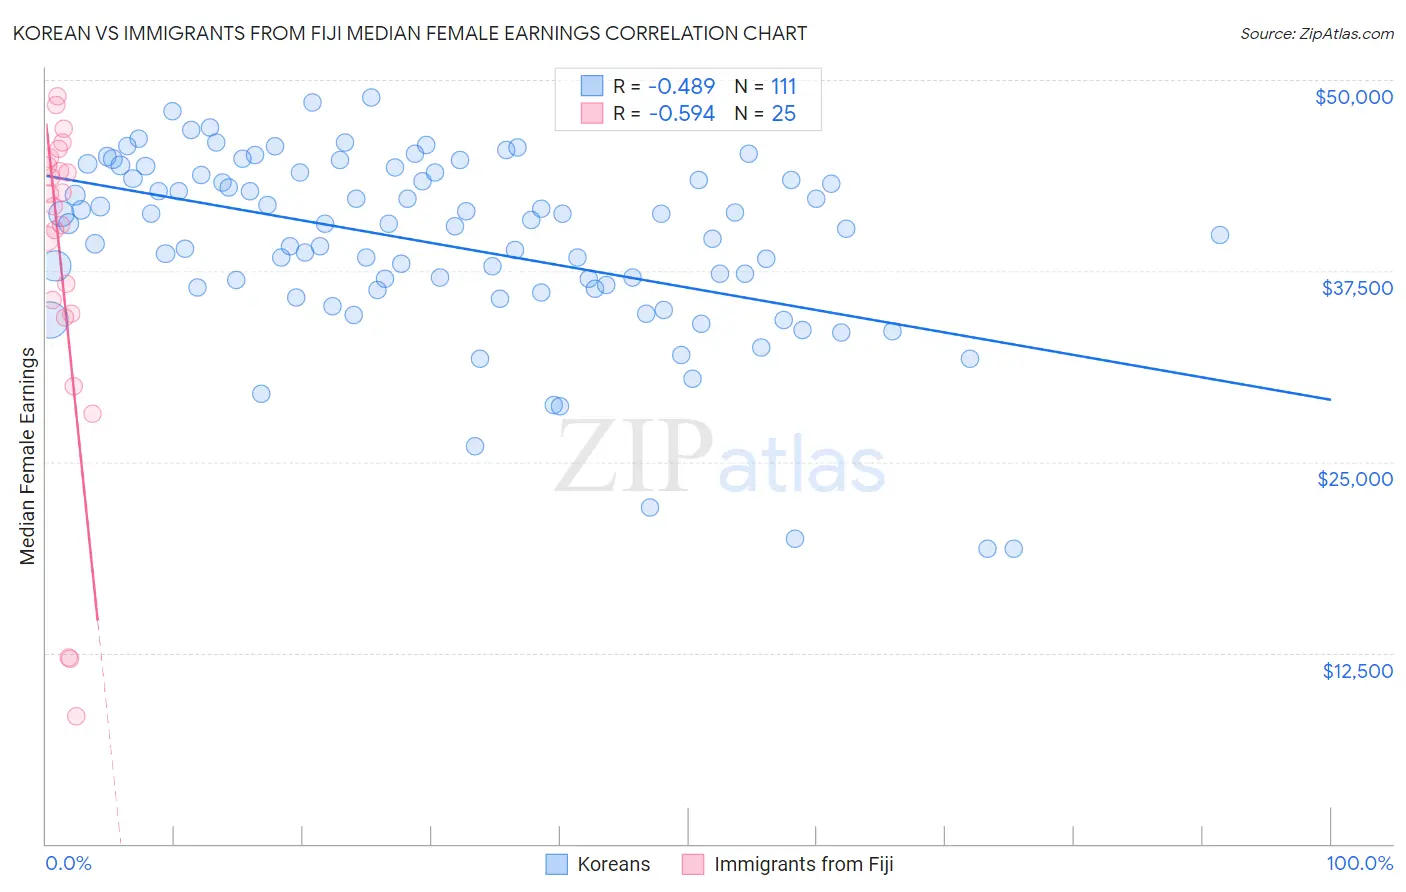
Korean vs Immigrants from Fiji Median Female Earnings Correlation Chart
The statistical analysis conducted on geographies consisting of 510,529,365 people shows a moderate negative correlation between the proportion of Koreans and median female earnings in the United States with a correlation coefficient (R) of -0.489 and weighted average of $41,276. Similarly, the statistical analysis conducted on geographies consisting of 93,750,474 people shows a substantial negative correlation between the proportion of Immigrants from Fiji and median female earnings in the United States with a correlation coefficient (R) of -0.594 and weighted average of $41,656, a difference of 0.92%.
Median Female Earnings Correlation Summary
| Measurement | Korean | Immigrants from Fiji |
| Minimum | $19,330 | $8,380 |
| Maximum | $48,873 | $48,941 |
| Range | $29,543 | $40,561 |
| Mean | $39,268 | $37,439 |
| Median | $40,570 | $41,723 |
| Interquartile 25% (IQ1) | $36,354 | $34,596 |
| Interquartile 75% (IQ3) | $43,801 | $44,642 |
| Interquartile Range (IQR) | $7,447 | $10,046 |
| Standard Deviation (Sample) | $6,022 | $11,332 |
| Standard Deviation (Population) | $5,995 | $11,103 |
Demographics Similar to Koreans and Immigrants from Fiji by Median Female Earnings
In terms of median female earnings, the demographic groups most similar to Koreans are Immigrants from England ($41,277, a difference of 0.0%), Immigrants from Brazil ($41,273, a difference of 0.010%), Macedonian ($41,286, a difference of 0.020%), Barbadian ($41,261, a difference of 0.040%), and Immigrants from North America ($41,319, a difference of 0.10%). Similarly, the demographic groups most similar to Immigrants from Fiji are Romanian ($41,663, a difference of 0.020%), Immigrants from Poland ($41,630, a difference of 0.060%), Immigrants from Barbados ($41,685, a difference of 0.070%), Immigrants from Argentina ($41,554, a difference of 0.25%), and Immigrants from Scotland ($41,771, a difference of 0.28%).
| Demographics | Rating | Rank | Median Female Earnings |
| Immigrants | Scotland | 98.7 /100 | #98 | Exceptional $41,771 |
| Immigrants | Barbados | 98.4 /100 | #99 | Exceptional $41,685 |
| Romanians | 98.3 /100 | #100 | Exceptional $41,663 |
| Immigrants | Fiji | 98.3 /100 | #101 | Exceptional $41,656 |
| Immigrants | Poland | 98.2 /100 | #102 | Exceptional $41,630 |
| Immigrants | Argentina | 97.9 /100 | #103 | Exceptional $41,554 |
| Immigrants | Zimbabwe | 97.8 /100 | #104 | Exceptional $41,527 |
| Italians | 97.7 /100 | #105 | Exceptional $41,505 |
| Immigrants | Eritrea | 97.6 /100 | #106 | Exceptional $41,485 |
| Palestinians | 97.6 /100 | #107 | Exceptional $41,484 |
| Jordanians | 97.5 /100 | #108 | Exceptional $41,464 |
| Chinese | 97.5 /100 | #109 | Exceptional $41,461 |
| Immigrants | Western Asia | 97.0 /100 | #110 | Exceptional $41,375 |
| Immigrants | Canada | 97.0 /100 | #111 | Exceptional $41,373 |
| Immigrants | North America | 96.7 /100 | #112 | Exceptional $41,319 |
| Macedonians | 96.4 /100 | #113 | Exceptional $41,286 |
| Immigrants | England | 96.4 /100 | #114 | Exceptional $41,277 |
| Koreans | 96.4 /100 | #115 | Exceptional $41,276 |
| Immigrants | Brazil | 96.4 /100 | #116 | Exceptional $41,273 |
| Barbadians | 96.3 /100 | #117 | Exceptional $41,261 |
| Immigrants | Lebanon | 95.6 /100 | #118 | Exceptional $41,183 |