Apache vs Ute Median Earnings
COMPARE
Apache
Ute
Median Earnings
Median Earnings Comparison
Apache
Ute
$40,388
MEDIAN EARNINGS
0.0/ 100
METRIC RATING
310th/ 347
METRIC RANK
$41,051
MEDIAN EARNINGS
0.1/ 100
METRIC RATING
300th/ 347
METRIC RANK
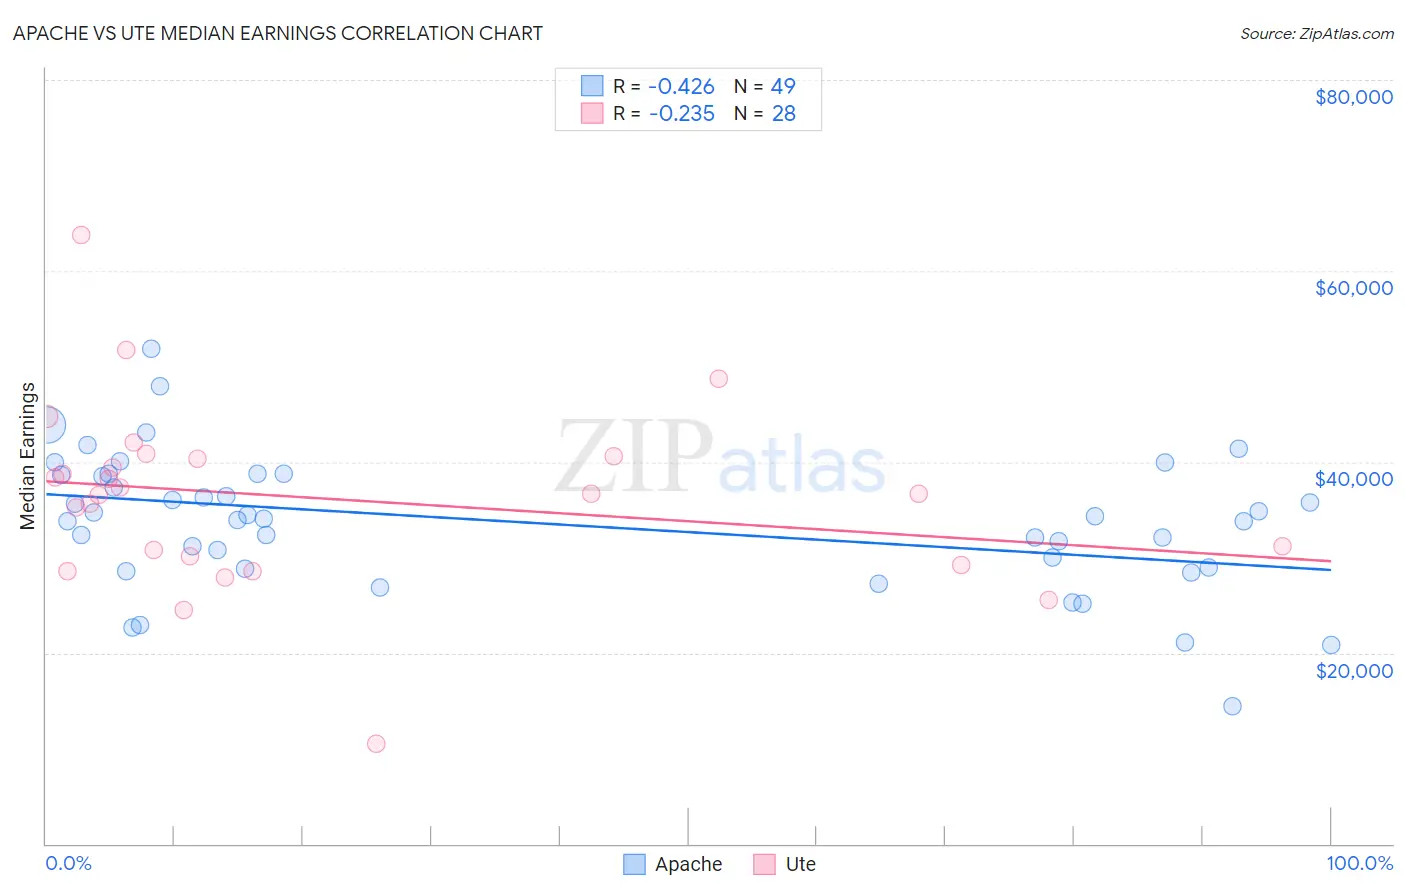
Apache vs Ute Median Earnings Correlation Chart
The statistical analysis conducted on geographies consisting of 231,119,863 people shows a moderate negative correlation between the proportion of Apache and median earnings in the United States with a correlation coefficient (R) of -0.426 and weighted average of $40,388. Similarly, the statistical analysis conducted on geographies consisting of 55,664,253 people shows a weak negative correlation between the proportion of Ute and median earnings in the United States with a correlation coefficient (R) of -0.235 and weighted average of $41,051, a difference of 1.6%.
Median Earnings Correlation Summary
| Measurement | Apache | Ute |
| Minimum | $14,458 | $10,500 |
| Maximum | $51,892 | $63,719 |
| Range | $37,433 | $53,219 |
| Mean | $33,634 | $36,165 |
| Median | $34,056 | $36,686 |
| Interquartile 25% (IQ1) | $28,886 | $29,690 |
| Interquartile 75% (IQ3) | $38,705 | $40,497 |
| Interquartile Range (IQR) | $9,819 | $10,807 |
| Standard Deviation (Sample) | $7,141 | $9,794 |
| Standard Deviation (Population) | $7,068 | $9,618 |
Demographics Similar to Apache and Ute by Median Earnings
In terms of median earnings, the demographic groups most similar to Apache are Hispanic or Latino ($40,288, a difference of 0.25%), Chippewa ($40,287, a difference of 0.25%), Choctaw ($40,270, a difference of 0.29%), Cheyenne ($40,233, a difference of 0.39%), and Seminole ($40,233, a difference of 0.39%). Similarly, the demographic groups most similar to Ute are Immigrants from Latin America ($41,049, a difference of 0.010%), Immigrants from Caribbean ($41,119, a difference of 0.17%), Immigrants from Micronesia ($41,133, a difference of 0.20%), Shoshone ($40,932, a difference of 0.29%), and Haitian ($40,918, a difference of 0.32%).
| Demographics | Rating | Rank | Median Earnings |
| Bangladeshis | 0.1 /100 | #295 | Tragic $41,263 |
| Cherokee | 0.1 /100 | #296 | Tragic $41,252 |
| Guatemalans | 0.1 /100 | #297 | Tragic $41,205 |
| Immigrants | Micronesia | 0.1 /100 | #298 | Tragic $41,133 |
| Immigrants | Caribbean | 0.1 /100 | #299 | Tragic $41,119 |
| Ute | 0.1 /100 | #300 | Tragic $41,051 |
| Immigrants | Latin America | 0.1 /100 | #301 | Tragic $41,049 |
| Shoshone | 0.0 /100 | #302 | Tragic $40,932 |
| Haitians | 0.0 /100 | #303 | Tragic $40,918 |
| Immigrants | Guatemala | 0.0 /100 | #304 | Tragic $40,851 |
| Chickasaw | 0.0 /100 | #305 | Tragic $40,672 |
| Yaqui | 0.0 /100 | #306 | Tragic $40,647 |
| Hondurans | 0.0 /100 | #307 | Tragic $40,638 |
| Cubans | 0.0 /100 | #308 | Tragic $40,619 |
| Immigrants | Haiti | 0.0 /100 | #309 | Tragic $40,550 |
| Apache | 0.0 /100 | #310 | Tragic $40,388 |
| Hispanics or Latinos | 0.0 /100 | #311 | Tragic $40,288 |
| Chippewa | 0.0 /100 | #312 | Tragic $40,287 |
| Choctaw | 0.0 /100 | #313 | Tragic $40,270 |
| Cheyenne | 0.0 /100 | #314 | Tragic $40,233 |
| Seminole | 0.0 /100 | #315 | Tragic $40,233 |