Immigrants from Northern Europe vs Ute Median Earnings
COMPARE
Immigrants from Northern Europe
Ute
Median Earnings
Median Earnings Comparison
Immigrants from Northern Europe
Ute
$53,872
MEDIAN EARNINGS
100.0/ 100
METRIC RATING
26th/ 347
METRIC RANK
$41,051
MEDIAN EARNINGS
0.1/ 100
METRIC RATING
300th/ 347
METRIC RANK
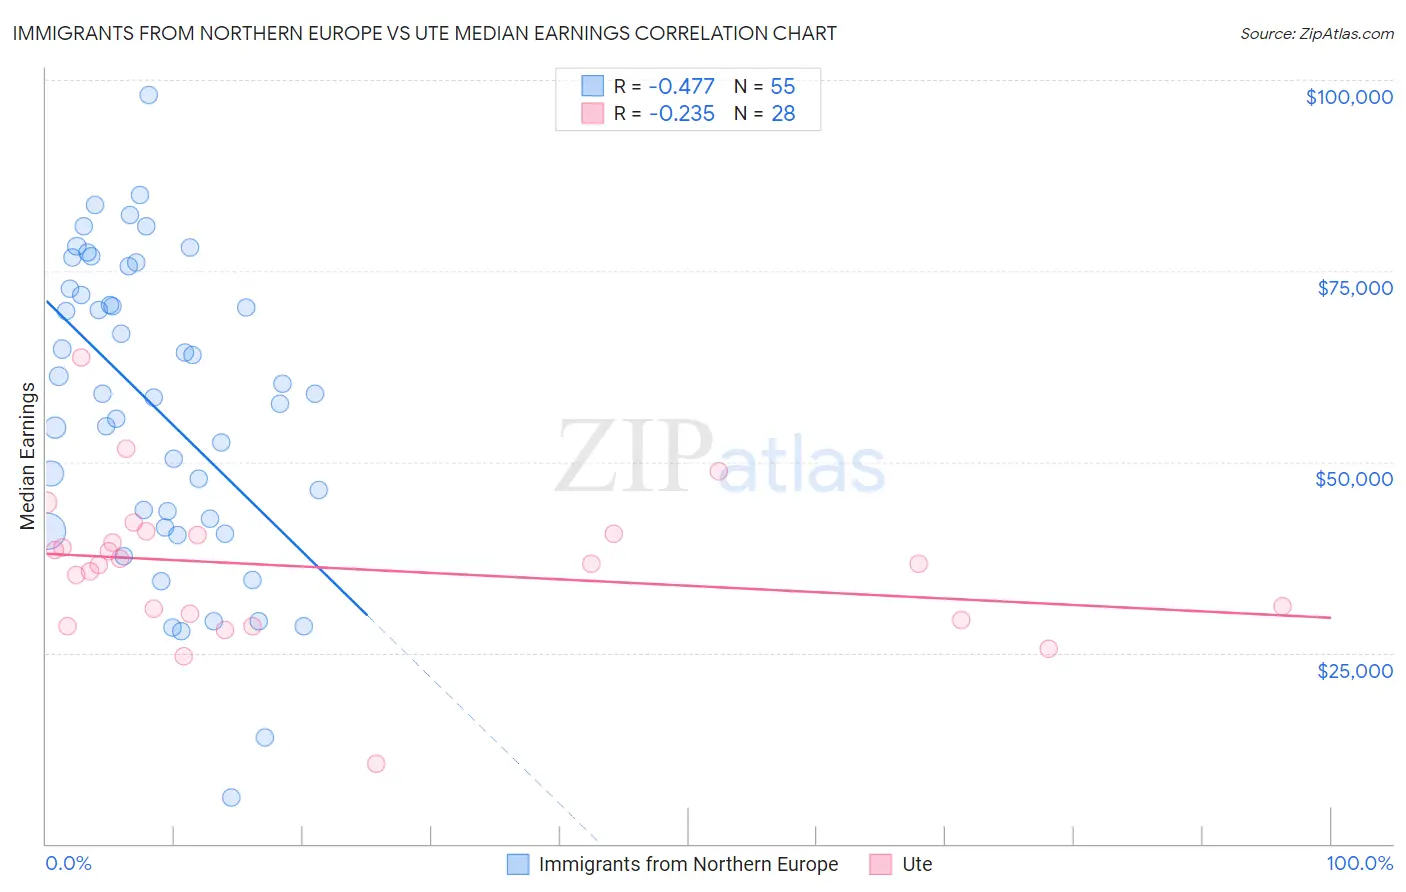
Immigrants from Northern Europe vs Ute Median Earnings Correlation Chart
The statistical analysis conducted on geographies consisting of 477,145,093 people shows a moderate negative correlation between the proportion of Immigrants from Northern Europe and median earnings in the United States with a correlation coefficient (R) of -0.477 and weighted average of $53,872. Similarly, the statistical analysis conducted on geographies consisting of 55,664,253 people shows a weak negative correlation between the proportion of Ute and median earnings in the United States with a correlation coefficient (R) of -0.235 and weighted average of $41,051, a difference of 31.2%.
Median Earnings Correlation Summary
| Measurement | Immigrants from Northern Europe | Ute |
| Minimum | $5,997 | $10,500 |
| Maximum | $98,000 | $63,719 |
| Range | $92,003 | $53,219 |
| Mean | $56,961 | $36,165 |
| Median | $58,943 | $36,686 |
| Interquartile 25% (IQ1) | $41,349 | $29,690 |
| Interquartile 75% (IQ3) | $72,683 | $40,497 |
| Interquartile Range (IQR) | $31,335 | $10,807 |
| Standard Deviation (Sample) | $19,840 | $9,794 |
| Standard Deviation (Population) | $19,659 | $9,618 |
Similar Demographics by Median Earnings
Demographics Similar to Immigrants from Northern Europe by Median Earnings
In terms of median earnings, the demographic groups most similar to Immigrants from Northern Europe are Turkish ($53,919, a difference of 0.090%), Asian ($53,690, a difference of 0.34%), Immigrants from France ($53,490, a difference of 0.71%), Soviet Union ($54,290, a difference of 0.78%), and Immigrants from Russia ($53,457, a difference of 0.78%).
| Demographics | Rating | Rank | Median Earnings |
| Immigrants | Belgium | 100.0 /100 | #19 | Exceptional $54,679 |
| Cypriots | 100.0 /100 | #20 | Exceptional $54,589 |
| Burmese | 100.0 /100 | #21 | Exceptional $54,559 |
| Immigrants | Korea | 100.0 /100 | #22 | Exceptional $54,530 |
| Immigrants | Sweden | 100.0 /100 | #23 | Exceptional $54,478 |
| Soviet Union | 100.0 /100 | #24 | Exceptional $54,290 |
| Turks | 100.0 /100 | #25 | Exceptional $53,919 |
| Immigrants | Northern Europe | 100.0 /100 | #26 | Exceptional $53,872 |
| Asians | 100.0 /100 | #27 | Exceptional $53,690 |
| Immigrants | France | 100.0 /100 | #28 | Exceptional $53,490 |
| Immigrants | Russia | 100.0 /100 | #29 | Exceptional $53,457 |
| Cambodians | 100.0 /100 | #30 | Exceptional $53,386 |
| Russians | 100.0 /100 | #31 | Exceptional $53,334 |
| Immigrants | Asia | 100.0 /100 | #32 | Exceptional $53,310 |
| Immigrants | Greece | 100.0 /100 | #33 | Exceptional $53,282 |
Demographics Similar to Ute by Median Earnings
In terms of median earnings, the demographic groups most similar to Ute are Immigrants from Latin America ($41,049, a difference of 0.010%), Immigrants from Caribbean ($41,119, a difference of 0.17%), Immigrants from Micronesia ($41,133, a difference of 0.20%), Shoshone ($40,932, a difference of 0.29%), and Haitian ($40,918, a difference of 0.32%).
| Demographics | Rating | Rank | Median Earnings |
| Immigrants | Zaire | 0.1 /100 | #293 | Tragic $41,325 |
| Potawatomi | 0.1 /100 | #294 | Tragic $41,288 |
| Bangladeshis | 0.1 /100 | #295 | Tragic $41,263 |
| Cherokee | 0.1 /100 | #296 | Tragic $41,252 |
| Guatemalans | 0.1 /100 | #297 | Tragic $41,205 |
| Immigrants | Micronesia | 0.1 /100 | #298 | Tragic $41,133 |
| Immigrants | Caribbean | 0.1 /100 | #299 | Tragic $41,119 |
| Ute | 0.1 /100 | #300 | Tragic $41,051 |
| Immigrants | Latin America | 0.1 /100 | #301 | Tragic $41,049 |
| Shoshone | 0.0 /100 | #302 | Tragic $40,932 |
| Haitians | 0.0 /100 | #303 | Tragic $40,918 |
| Immigrants | Guatemala | 0.0 /100 | #304 | Tragic $40,851 |
| Chickasaw | 0.0 /100 | #305 | Tragic $40,672 |
| Yaqui | 0.0 /100 | #306 | Tragic $40,647 |
| Hondurans | 0.0 /100 | #307 | Tragic $40,638 |