Apache vs Argentinean Median Earnings
COMPARE
Apache
Argentinean
Median Earnings
Median Earnings Comparison
Apache
Argentineans
$40,388
MEDIAN EARNINGS
0.0/ 100
METRIC RATING
310th/ 347
METRIC RANK
$50,399
MEDIAN EARNINGS
99.6/ 100
METRIC RATING
78th/ 347
METRIC RANK
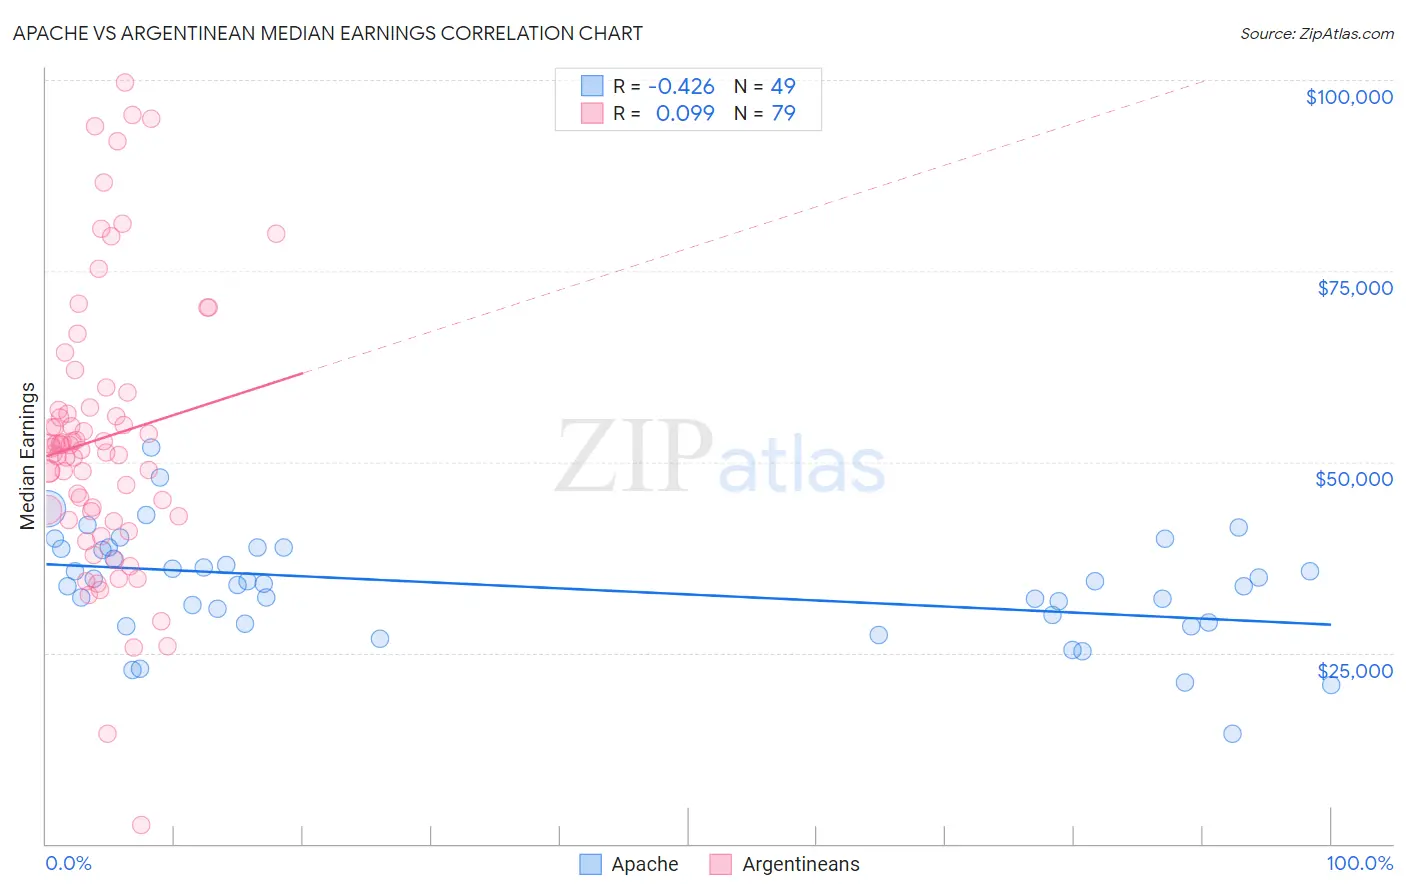
Apache vs Argentinean Median Earnings Correlation Chart
The statistical analysis conducted on geographies consisting of 231,119,863 people shows a moderate negative correlation between the proportion of Apache and median earnings in the United States with a correlation coefficient (R) of -0.426 and weighted average of $40,388. Similarly, the statistical analysis conducted on geographies consisting of 297,136,392 people shows a slight positive correlation between the proportion of Argentineans and median earnings in the United States with a correlation coefficient (R) of 0.099 and weighted average of $50,399, a difference of 24.8%.
Median Earnings Correlation Summary
| Measurement | Apache | Argentinean |
| Minimum | $14,458 | $2,499 |
| Maximum | $51,892 | $99,706 |
| Range | $37,433 | $97,207 |
| Mean | $33,634 | $53,044 |
| Median | $34,056 | $51,898 |
| Interquartile 25% (IQ1) | $28,886 | $42,917 |
| Interquartile 75% (IQ3) | $38,705 | $57,109 |
| Interquartile Range (IQR) | $9,819 | $14,192 |
| Standard Deviation (Sample) | $7,141 | $18,063 |
| Standard Deviation (Population) | $7,068 | $17,948 |
Similar Demographics by Median Earnings
Demographics Similar to Apache by Median Earnings
In terms of median earnings, the demographic groups most similar to Apache are Hispanic or Latino ($40,288, a difference of 0.25%), Chippewa ($40,287, a difference of 0.25%), Choctaw ($40,270, a difference of 0.29%), Cheyenne ($40,233, a difference of 0.39%), and Seminole ($40,233, a difference of 0.39%).
| Demographics | Rating | Rank | Median Earnings |
| Haitians | 0.0 /100 | #303 | Tragic $40,918 |
| Immigrants | Guatemala | 0.0 /100 | #304 | Tragic $40,851 |
| Chickasaw | 0.0 /100 | #305 | Tragic $40,672 |
| Yaqui | 0.0 /100 | #306 | Tragic $40,647 |
| Hondurans | 0.0 /100 | #307 | Tragic $40,638 |
| Cubans | 0.0 /100 | #308 | Tragic $40,619 |
| Immigrants | Haiti | 0.0 /100 | #309 | Tragic $40,550 |
| Apache | 0.0 /100 | #310 | Tragic $40,388 |
| Hispanics or Latinos | 0.0 /100 | #311 | Tragic $40,288 |
| Chippewa | 0.0 /100 | #312 | Tragic $40,287 |
| Choctaw | 0.0 /100 | #313 | Tragic $40,270 |
| Cheyenne | 0.0 /100 | #314 | Tragic $40,233 |
| Seminole | 0.0 /100 | #315 | Tragic $40,233 |
| Immigrants | Honduras | 0.0 /100 | #316 | Tragic $40,195 |
| Fijians | 0.0 /100 | #317 | Tragic $40,193 |
Demographics Similar to Argentineans by Median Earnings
In terms of median earnings, the demographic groups most similar to Argentineans are Laotian ($50,343, a difference of 0.11%), Ukrainian ($50,320, a difference of 0.16%), Immigrants from Southern Europe ($50,280, a difference of 0.24%), Immigrants from Moldova ($50,274, a difference of 0.25%), and Immigrants from Western Europe ($50,549, a difference of 0.30%).
| Demographics | Rating | Rank | Median Earnings |
| Immigrants | Ukraine | 99.8 /100 | #71 | Exceptional $50,984 |
| Immigrants | Egypt | 99.8 /100 | #72 | Exceptional $50,901 |
| Immigrants | Netherlands | 99.8 /100 | #73 | Exceptional $50,818 |
| South Africans | 99.8 /100 | #74 | Exceptional $50,752 |
| Immigrants | Scotland | 99.8 /100 | #75 | Exceptional $50,741 |
| Immigrants | Italy | 99.7 /100 | #76 | Exceptional $50,581 |
| Immigrants | Western Europe | 99.7 /100 | #77 | Exceptional $50,549 |
| Argentineans | 99.6 /100 | #78 | Exceptional $50,399 |
| Laotians | 99.6 /100 | #79 | Exceptional $50,343 |
| Ukrainians | 99.6 /100 | #80 | Exceptional $50,320 |
| Immigrants | Southern Europe | 99.6 /100 | #81 | Exceptional $50,280 |
| Immigrants | Moldova | 99.5 /100 | #82 | Exceptional $50,274 |
| Romanians | 99.5 /100 | #83 | Exceptional $50,244 |
| Immigrants | Hungary | 99.5 /100 | #84 | Exceptional $50,227 |
| Immigrants | Kazakhstan | 99.5 /100 | #85 | Exceptional $50,225 |