Apache vs Ute In Labor Force | Age 16-19
COMPARE
Apache
Ute
In Labor Force | Age 16-19
In Labor Force | Age 16-19 Comparison
Apache
Ute
35.6%
IN LABOR FORCE | AGE 16-19
11.0/ 100
METRIC RATING
214th/ 347
METRIC RANK
37.1%
IN LABOR FORCE | AGE 16-19
75.7/ 100
METRIC RATING
158th/ 347
METRIC RANK
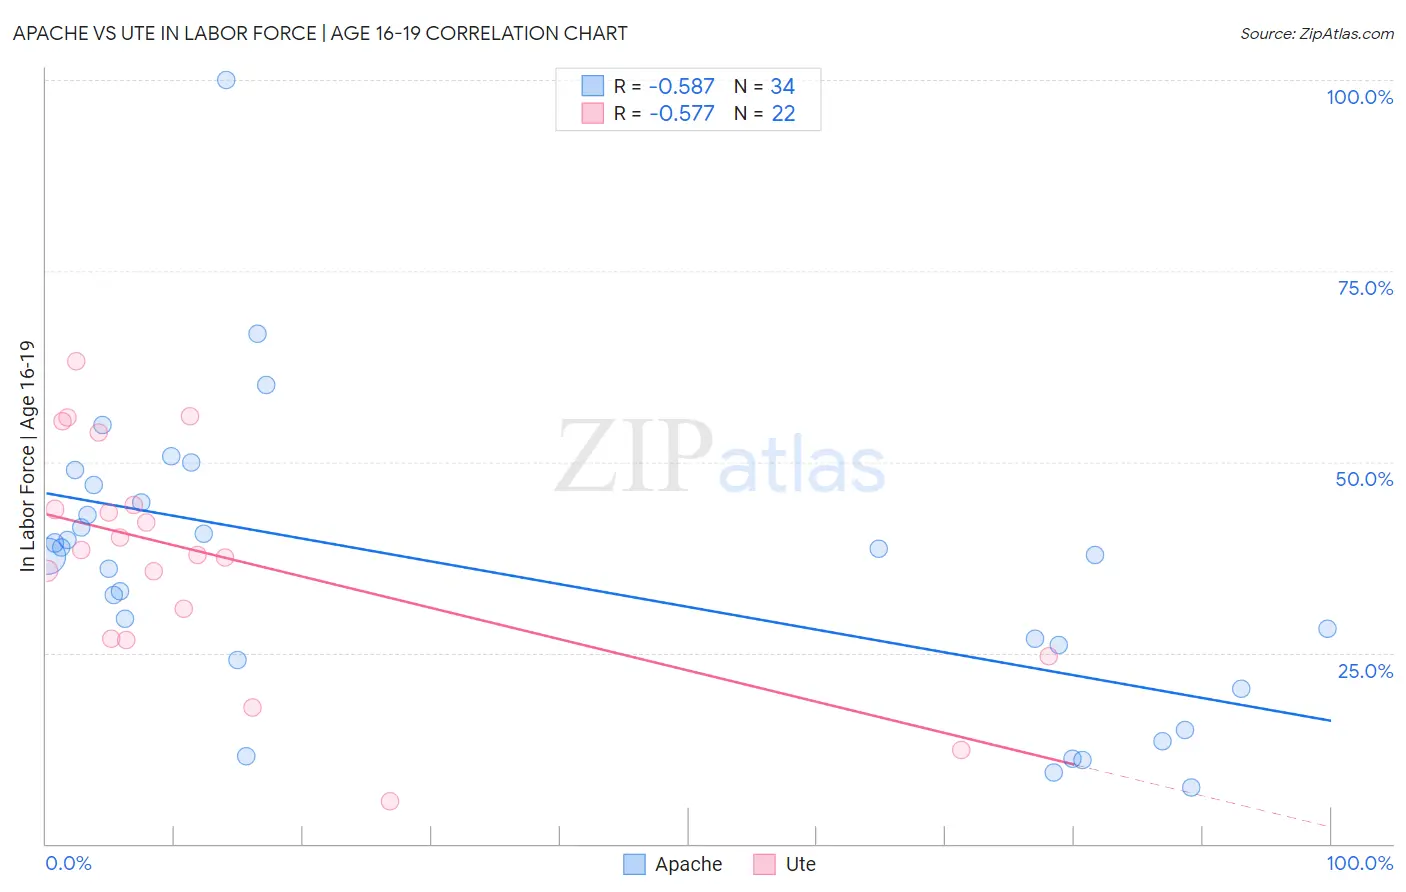
Apache vs Ute In Labor Force | Age 16-19 Correlation Chart
The statistical analysis conducted on geographies consisting of 230,841,914 people shows a substantial negative correlation between the proportion of Apache and labor force participation rate among population between the ages 16 and 19 in the United States with a correlation coefficient (R) of -0.587 and weighted average of 35.6%. Similarly, the statistical analysis conducted on geographies consisting of 55,645,372 people shows a substantial negative correlation between the proportion of Ute and labor force participation rate among population between the ages 16 and 19 in the United States with a correlation coefficient (R) of -0.577 and weighted average of 37.1%, a difference of 4.2%.
In Labor Force | Age 16-19 Correlation Summary
| Measurement | Apache | Ute |
| Minimum | 7.4% | 5.6% |
| Maximum | 100.0% | 63.1% |
| Range | 92.6% | 57.5% |
| Mean | 35.7% | 37.6% |
| Median | 37.7% | 38.1% |
| Interquartile 25% (IQ1) | 24.0% | 26.8% |
| Interquartile 75% (IQ3) | 44.6% | 44.4% |
| Interquartile Range (IQR) | 20.6% | 17.6% |
| Standard Deviation (Sample) | 19.0% | 14.7% |
| Standard Deviation (Population) | 18.7% | 14.4% |
Similar Demographics by In Labor Force | Age 16-19
Demographics Similar to Apache by In Labor Force | Age 16-19
In terms of in labor force | age 16-19, the demographic groups most similar to Apache are Houma (35.6%, a difference of 0.010%), Immigrants from Bolivia (35.6%, a difference of 0.010%), Immigrants from South Eastern Asia (35.6%, a difference of 0.020%), Dutch West Indian (35.6%, a difference of 0.040%), and Immigrants from Costa Rica (35.6%, a difference of 0.040%).
| Demographics | Rating | Rank | In Labor Force | Age 16-19 |
| Immigrants | Eastern Europe | 14.5 /100 | #207 | Poor 35.8% |
| Koreans | 13.3 /100 | #208 | Poor 35.7% |
| Moroccans | 12.7 /100 | #209 | Poor 35.7% |
| Immigrants | Switzerland | 11.9 /100 | #210 | Poor 35.6% |
| Mexicans | 11.9 /100 | #211 | Poor 35.6% |
| Houma | 11.0 /100 | #212 | Poor 35.6% |
| Immigrants | Bolivia | 11.0 /100 | #213 | Poor 35.6% |
| Apache | 11.0 /100 | #214 | Poor 35.6% |
| Immigrants | South Eastern Asia | 10.8 /100 | #215 | Poor 35.6% |
| Dutch West Indians | 10.7 /100 | #216 | Poor 35.6% |
| Immigrants | Costa Rica | 10.7 /100 | #217 | Poor 35.6% |
| Sri Lankans | 9.8 /100 | #218 | Tragic 35.5% |
| Guatemalans | 8.6 /100 | #219 | Tragic 35.5% |
| Immigrants | Bahamas | 8.3 /100 | #220 | Tragic 35.5% |
| Turks | 7.3 /100 | #221 | Tragic 35.4% |
Demographics Similar to Ute by In Labor Force | Age 16-19
In terms of in labor force | age 16-19, the demographic groups most similar to Ute are Immigrants from Brazil (37.1%, a difference of 0.050%), Yaqui (37.1%, a difference of 0.080%), Immigrants from Saudi Arabia (37.0%, a difference of 0.12%), Cambodian (37.0%, a difference of 0.27%), and Kiowa (37.2%, a difference of 0.34%).
| Demographics | Rating | Rank | In Labor Force | Age 16-19 |
| Immigrants | Poland | 84.4 /100 | #151 | Excellent 37.3% |
| Immigrants | Sierra Leone | 83.6 /100 | #152 | Excellent 37.3% |
| Arapaho | 81.8 /100 | #153 | Excellent 37.3% |
| Immigrants | Bulgaria | 81.6 /100 | #154 | Excellent 37.3% |
| Immigrants | Lithuania | 80.7 /100 | #155 | Excellent 37.2% |
| Kiowa | 80.4 /100 | #156 | Excellent 37.2% |
| Immigrants | Brazil | 76.5 /100 | #157 | Good 37.1% |
| Ute | 75.7 /100 | #158 | Good 37.1% |
| Yaqui | 74.4 /100 | #159 | Good 37.1% |
| Immigrants | Saudi Arabia | 73.9 /100 | #160 | Good 37.0% |
| Cambodians | 71.5 /100 | #161 | Good 37.0% |
| Immigrants | Jordan | 69.5 /100 | #162 | Good 36.9% |
| Bermudans | 69.3 /100 | #163 | Good 36.9% |
| Immigrants | Kuwait | 68.9 /100 | #164 | Good 36.9% |
| Yakama | 66.9 /100 | #165 | Good 36.9% |