Apache vs Immigrants from Venezuela Median Earnings
COMPARE
Apache
Immigrants from Venezuela
Median Earnings
Median Earnings Comparison
Apache
Immigrants from Venezuela
$40,388
MEDIAN EARNINGS
0.0/ 100
METRIC RATING
310th/ 347
METRIC RANK
$44,163
MEDIAN EARNINGS
4.0/ 100
METRIC RATING
242nd/ 347
METRIC RANK
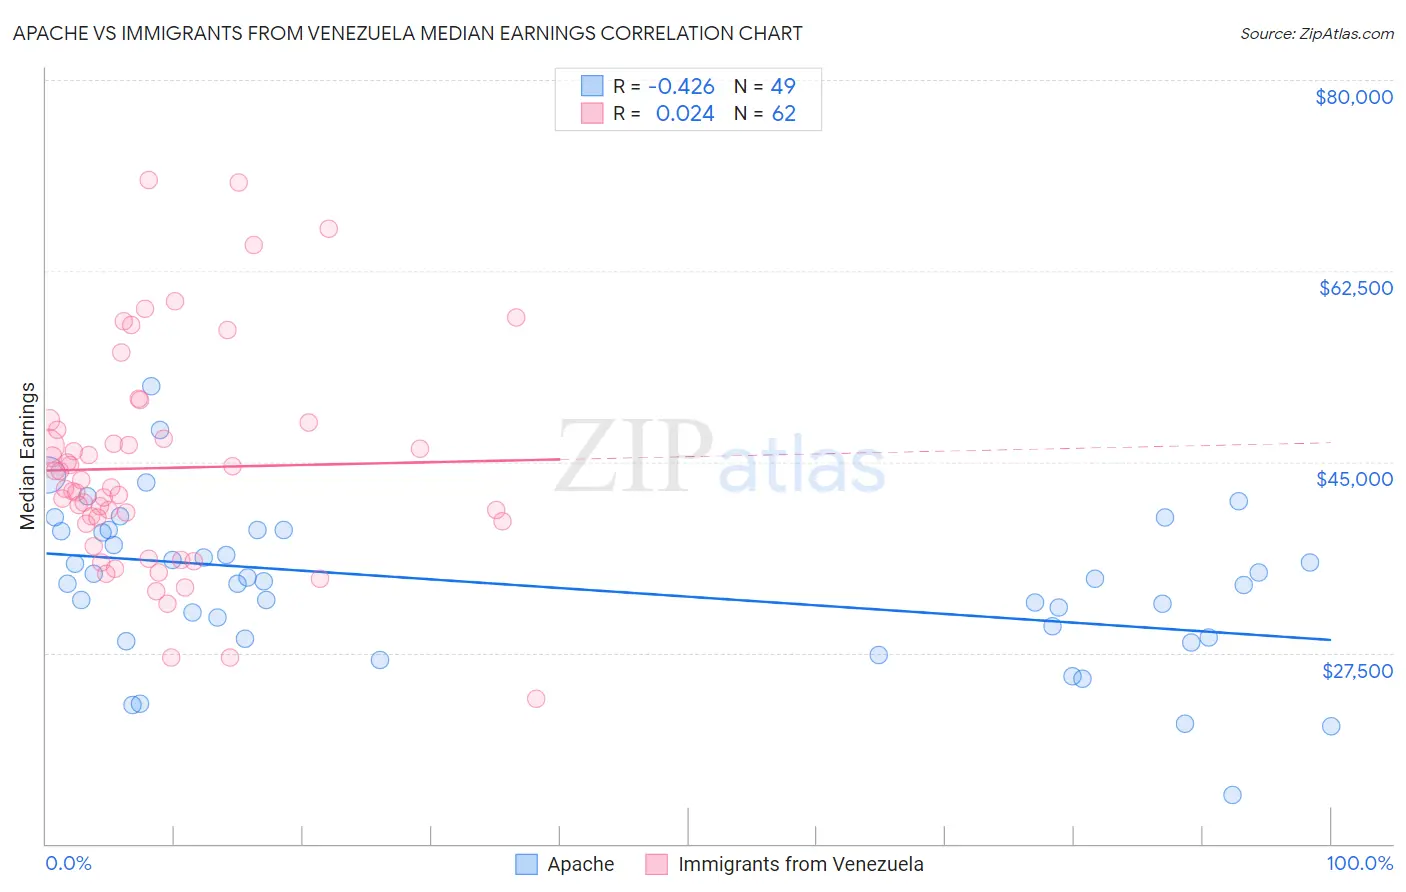
Apache vs Immigrants from Venezuela Median Earnings Correlation Chart
The statistical analysis conducted on geographies consisting of 231,119,863 people shows a moderate negative correlation between the proportion of Apache and median earnings in the United States with a correlation coefficient (R) of -0.426 and weighted average of $40,388. Similarly, the statistical analysis conducted on geographies consisting of 287,839,546 people shows no correlation between the proportion of Immigrants from Venezuela and median earnings in the United States with a correlation coefficient (R) of 0.024 and weighted average of $44,163, a difference of 9.3%.
Median Earnings Correlation Summary
| Measurement | Apache | Immigrants from Venezuela |
| Minimum | $14,458 | $23,314 |
| Maximum | $51,892 | $70,871 |
| Range | $37,433 | $47,557 |
| Mean | $33,634 | $44,436 |
| Median | $34,056 | $42,584 |
| Interquartile 25% (IQ1) | $28,886 | $39,305 |
| Interquartile 75% (IQ3) | $38,705 | $47,920 |
| Interquartile Range (IQR) | $9,819 | $8,616 |
| Standard Deviation (Sample) | $7,141 | $9,975 |
| Standard Deviation (Population) | $7,068 | $9,895 |
Similar Demographics by Median Earnings
Demographics Similar to Apache by Median Earnings
In terms of median earnings, the demographic groups most similar to Apache are Hispanic or Latino ($40,288, a difference of 0.25%), Chippewa ($40,287, a difference of 0.25%), Choctaw ($40,270, a difference of 0.29%), Cheyenne ($40,233, a difference of 0.39%), and Seminole ($40,233, a difference of 0.39%).
| Demographics | Rating | Rank | Median Earnings |
| Haitians | 0.0 /100 | #303 | Tragic $40,918 |
| Immigrants | Guatemala | 0.0 /100 | #304 | Tragic $40,851 |
| Chickasaw | 0.0 /100 | #305 | Tragic $40,672 |
| Yaqui | 0.0 /100 | #306 | Tragic $40,647 |
| Hondurans | 0.0 /100 | #307 | Tragic $40,638 |
| Cubans | 0.0 /100 | #308 | Tragic $40,619 |
| Immigrants | Haiti | 0.0 /100 | #309 | Tragic $40,550 |
| Apache | 0.0 /100 | #310 | Tragic $40,388 |
| Hispanics or Latinos | 0.0 /100 | #311 | Tragic $40,288 |
| Chippewa | 0.0 /100 | #312 | Tragic $40,287 |
| Choctaw | 0.0 /100 | #313 | Tragic $40,270 |
| Cheyenne | 0.0 /100 | #314 | Tragic $40,233 |
| Seminole | 0.0 /100 | #315 | Tragic $40,233 |
| Immigrants | Honduras | 0.0 /100 | #316 | Tragic $40,195 |
| Fijians | 0.0 /100 | #317 | Tragic $40,193 |
Demographics Similar to Immigrants from Venezuela by Median Earnings
In terms of median earnings, the demographic groups most similar to Immigrants from Venezuela are Samoan ($44,206, a difference of 0.10%), Subsaharan African ($44,118, a difference of 0.10%), Nonimmigrants ($44,117, a difference of 0.10%), Aleut ($44,241, a difference of 0.18%), and Immigrants from Burma/Myanmar ($43,998, a difference of 0.37%).
| Demographics | Rating | Rank | Median Earnings |
| Venezuelans | 6.9 /100 | #235 | Tragic $44,580 |
| British West Indians | 6.7 /100 | #236 | Tragic $44,552 |
| Immigrants | Ecuador | 5.9 /100 | #237 | Tragic $44,462 |
| Sudanese | 5.6 /100 | #238 | Tragic $44,419 |
| Senegalese | 5.3 /100 | #239 | Tragic $44,373 |
| Aleuts | 4.4 /100 | #240 | Tragic $44,241 |
| Samoans | 4.2 /100 | #241 | Tragic $44,206 |
| Immigrants | Venezuela | 4.0 /100 | #242 | Tragic $44,163 |
| Sub-Saharan Africans | 3.7 /100 | #243 | Tragic $44,118 |
| Immigrants | Nonimmigrants | 3.7 /100 | #244 | Tragic $44,117 |
| Immigrants | Burma/Myanmar | 3.2 /100 | #245 | Tragic $43,998 |
| Immigrants | West Indies | 3.1 /100 | #246 | Tragic $43,989 |
| Immigrants | Cabo Verde | 3.0 /100 | #247 | Tragic $43,963 |
| Nepalese | 2.6 /100 | #248 | Tragic $43,860 |
| Malaysians | 2.6 /100 | #249 | Tragic $43,844 |