Tsimshian vs Osage Median Household Income
COMPARE
Tsimshian
Osage
Median Household Income
Median Household Income Comparison
Tsimshian
Osage
$83,346
MEDIAN HOUSEHOLD INCOME
24.5/ 100
METRIC RATING
200th/ 347
METRIC RANK
$75,240
MEDIAN HOUSEHOLD INCOME
0.2/ 100
METRIC RATING
278th/ 347
METRIC RANK
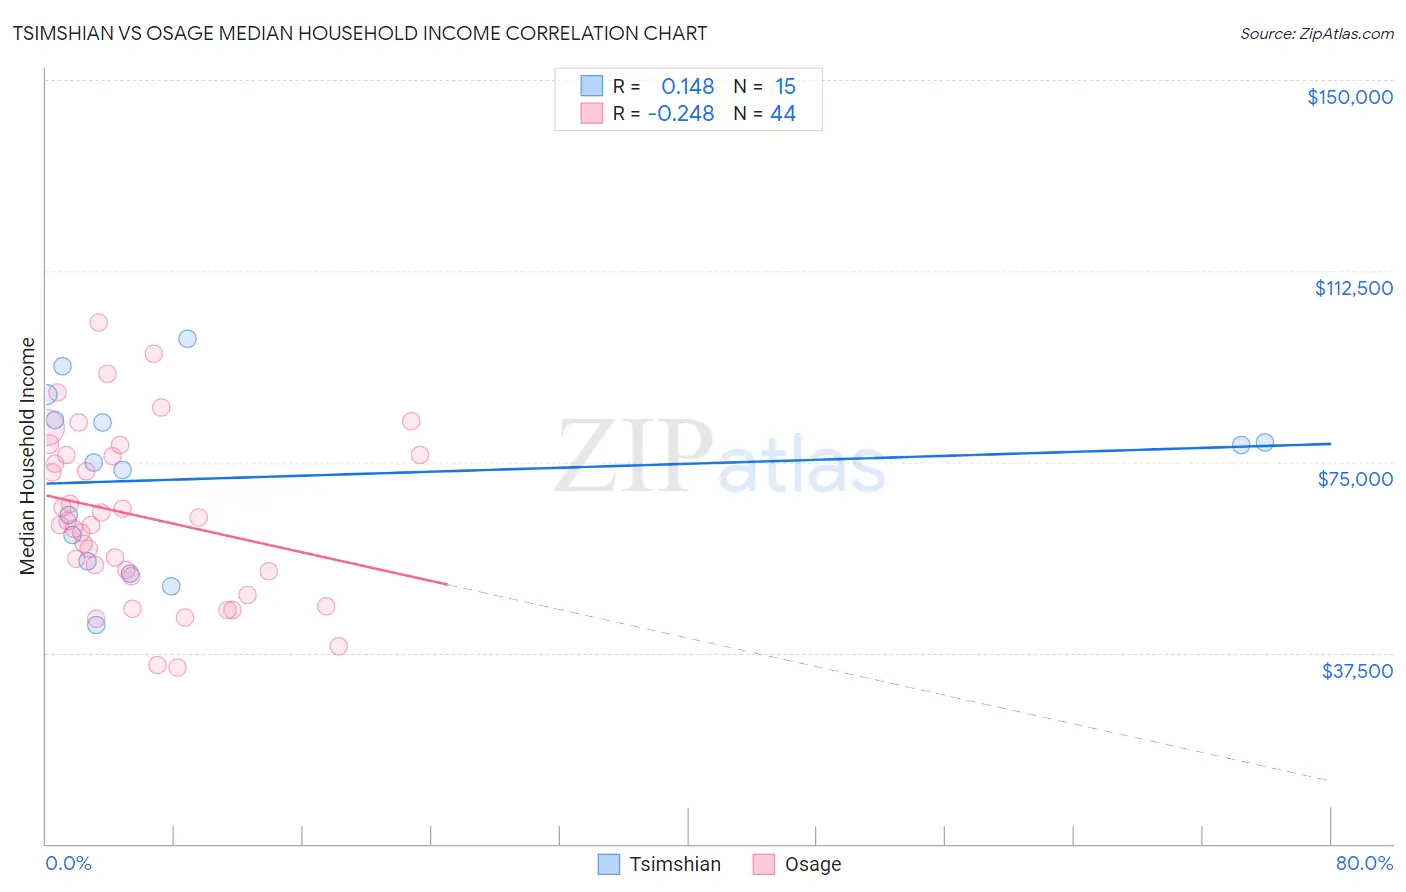
Tsimshian vs Osage Median Household Income Correlation Chart
The statistical analysis conducted on geographies consisting of 15,626,462 people shows a poor positive correlation between the proportion of Tsimshian and median household income in the United States with a correlation coefficient (R) of 0.148 and weighted average of $83,346. Similarly, the statistical analysis conducted on geographies consisting of 91,796,475 people shows a weak negative correlation between the proportion of Osage and median household income in the United States with a correlation coefficient (R) of -0.248 and weighted average of $75,240, a difference of 10.8%.
Median Household Income Correlation Summary
| Measurement | Tsimshian | Osage |
| Minimum | $42,857 | $34,735 |
| Maximum | $99,167 | $102,379 |
| Range | $56,310 | $67,644 |
| Mean | $71,994 | $64,368 |
| Median | $75,000 | $62,912 |
| Interquartile 25% (IQ1) | $55,448 | $52,984 |
| Interquartile 75% (IQ3) | $83,217 | $76,272 |
| Interquartile Range (IQR) | $27,769 | $23,288 |
| Standard Deviation (Sample) | $16,777 | $16,574 |
| Standard Deviation (Population) | $16,208 | $16,385 |
Similar Demographics by Median Household Income
Demographics Similar to Tsimshian by Median Household Income
In terms of median household income, the demographic groups most similar to Tsimshian are Spanish ($83,343, a difference of 0.0%), German ($83,358, a difference of 0.010%), Immigrants from Thailand ($83,327, a difference of 0.020%), Immigrants from Cambodia ($83,304, a difference of 0.050%), and Japanese ($83,395, a difference of 0.060%).
| Demographics | Rating | Rank | Median Household Income |
| Finns | 27.7 /100 | #193 | Fair $83,607 |
| Ghanaians | 27.4 /100 | #194 | Fair $83,582 |
| Immigrants | Armenia | 27.0 /100 | #195 | Fair $83,555 |
| French | 26.0 /100 | #196 | Fair $83,468 |
| Aleuts | 25.7 /100 | #197 | Fair $83,446 |
| Japanese | 25.1 /100 | #198 | Fair $83,395 |
| Germans | 24.6 /100 | #199 | Fair $83,358 |
| Tsimshian | 24.5 /100 | #200 | Fair $83,346 |
| Spanish | 24.4 /100 | #201 | Fair $83,343 |
| Immigrants | Thailand | 24.3 /100 | #202 | Fair $83,327 |
| Immigrants | Cambodia | 24.0 /100 | #203 | Fair $83,304 |
| Immigrants | Africa | 23.8 /100 | #204 | Fair $83,289 |
| Celtics | 22.7 /100 | #205 | Fair $83,193 |
| Immigrants | Kenya | 21.3 /100 | #206 | Fair $83,068 |
| Dutch | 20.3 /100 | #207 | Fair $82,971 |
Demographics Similar to Osage by Median Household Income
In terms of median household income, the demographic groups most similar to Osage are Immigrants from Guatemala ($75,123, a difference of 0.16%), Spanish American ($75,386, a difference of 0.19%), Immigrants from Latin America ($75,420, a difference of 0.24%), Senegalese ($74,999, a difference of 0.32%), and Immigrants from Micronesia ($75,574, a difference of 0.44%).
| Demographics | Rating | Rank | Median Household Income |
| Pennsylvania Germans | 0.3 /100 | #271 | Tragic $75,814 |
| Somalis | 0.3 /100 | #272 | Tragic $75,782 |
| Liberians | 0.2 /100 | #273 | Tragic $75,667 |
| British West Indians | 0.2 /100 | #274 | Tragic $75,647 |
| Immigrants | Micronesia | 0.2 /100 | #275 | Tragic $75,574 |
| Immigrants | Latin America | 0.2 /100 | #276 | Tragic $75,420 |
| Spanish Americans | 0.2 /100 | #277 | Tragic $75,386 |
| Osage | 0.2 /100 | #278 | Tragic $75,240 |
| Immigrants | Guatemala | 0.2 /100 | #279 | Tragic $75,123 |
| Senegalese | 0.2 /100 | #280 | Tragic $74,999 |
| Immigrants | Liberia | 0.1 /100 | #281 | Tragic $74,896 |
| Central American Indians | 0.1 /100 | #282 | Tragic $74,847 |
| Cree | 0.1 /100 | #283 | Tragic $74,685 |
| Yaqui | 0.1 /100 | #284 | Tragic $74,596 |
| Mexicans | 0.1 /100 | #285 | Tragic $74,399 |