Guamanian/Chamorro vs Osage Median Household Income
COMPARE
Guamanian/Chamorro
Osage
Median Household Income
Median Household Income Comparison
Guamanians/Chamorros
Osage
$86,255
MEDIAN HOUSEHOLD INCOME
67.7/ 100
METRIC RATING
162nd/ 347
METRIC RANK
$75,240
MEDIAN HOUSEHOLD INCOME
0.2/ 100
METRIC RATING
278th/ 347
METRIC RANK
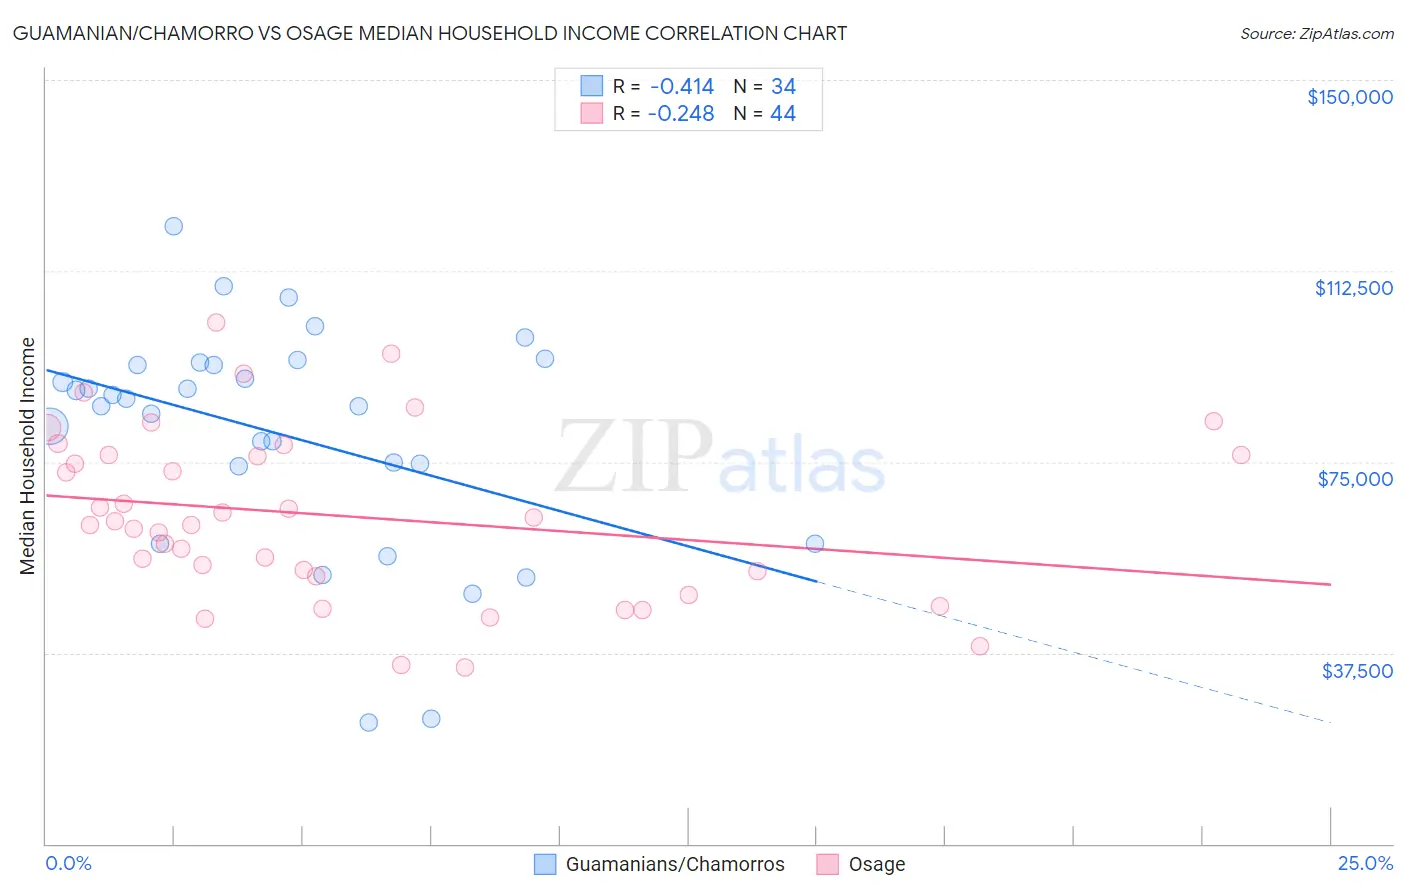
Guamanian/Chamorro vs Osage Median Household Income Correlation Chart
The statistical analysis conducted on geographies consisting of 221,863,113 people shows a moderate negative correlation between the proportion of Guamanians/Chamorros and median household income in the United States with a correlation coefficient (R) of -0.414 and weighted average of $86,255. Similarly, the statistical analysis conducted on geographies consisting of 91,796,475 people shows a weak negative correlation between the proportion of Osage and median household income in the United States with a correlation coefficient (R) of -0.248 and weighted average of $75,240, a difference of 14.6%.
Median Household Income Correlation Summary
| Measurement | Guamanian/Chamorro | Osage |
| Minimum | $23,750 | $34,735 |
| Maximum | $121,240 | $102,379 |
| Range | $97,490 | $67,644 |
| Mean | $80,405 | $64,368 |
| Median | $86,640 | $62,912 |
| Interquartile 25% (IQ1) | $74,171 | $52,984 |
| Interquartile 75% (IQ3) | $94,093 | $76,272 |
| Interquartile Range (IQR) | $19,922 | $23,288 |
| Standard Deviation (Sample) | $22,128 | $16,574 |
| Standard Deviation (Population) | $21,800 | $16,385 |
Similar Demographics by Median Household Income
Demographics Similar to Guamanians/Chamorros by Median Household Income
In terms of median household income, the demographic groups most similar to Guamanians/Chamorros are Czech ($86,164, a difference of 0.11%), Irish ($86,145, a difference of 0.13%), Slavic ($86,398, a difference of 0.17%), Luxembourger ($86,418, a difference of 0.19%), and Immigrants from Uzbekistan ($86,425, a difference of 0.20%).
| Demographics | Rating | Rank | Median Household Income |
| Carpatho Rusyns | 72.8 /100 | #155 | Good $86,635 |
| Immigrants | Albania | 71.5 /100 | #156 | Good $86,534 |
| Samoans | 71.0 /100 | #157 | Good $86,498 |
| Moroccans | 70.6 /100 | #158 | Good $86,468 |
| Immigrants | Uzbekistan | 70.1 /100 | #159 | Good $86,425 |
| Luxembourgers | 70.0 /100 | #160 | Good $86,418 |
| Slavs | 69.7 /100 | #161 | Good $86,398 |
| Guamanians/Chamorros | 67.7 /100 | #162 | Good $86,255 |
| Czechs | 66.4 /100 | #163 | Good $86,164 |
| Irish | 66.2 /100 | #164 | Good $86,145 |
| Norwegians | 65.3 /100 | #165 | Good $86,084 |
| Scandinavians | 65.1 /100 | #166 | Good $86,073 |
| Immigrants | Immigrants | 61.3 /100 | #167 | Good $85,818 |
| Icelanders | 61.0 /100 | #168 | Good $85,797 |
| Colombians | 59.7 /100 | #169 | Average $85,716 |
Demographics Similar to Osage by Median Household Income
In terms of median household income, the demographic groups most similar to Osage are Immigrants from Guatemala ($75,123, a difference of 0.16%), Spanish American ($75,386, a difference of 0.19%), Immigrants from Latin America ($75,420, a difference of 0.24%), Senegalese ($74,999, a difference of 0.32%), and Immigrants from Micronesia ($75,574, a difference of 0.44%).
| Demographics | Rating | Rank | Median Household Income |
| Pennsylvania Germans | 0.3 /100 | #271 | Tragic $75,814 |
| Somalis | 0.3 /100 | #272 | Tragic $75,782 |
| Liberians | 0.2 /100 | #273 | Tragic $75,667 |
| British West Indians | 0.2 /100 | #274 | Tragic $75,647 |
| Immigrants | Micronesia | 0.2 /100 | #275 | Tragic $75,574 |
| Immigrants | Latin America | 0.2 /100 | #276 | Tragic $75,420 |
| Spanish Americans | 0.2 /100 | #277 | Tragic $75,386 |
| Osage | 0.2 /100 | #278 | Tragic $75,240 |
| Immigrants | Guatemala | 0.2 /100 | #279 | Tragic $75,123 |
| Senegalese | 0.2 /100 | #280 | Tragic $74,999 |
| Immigrants | Liberia | 0.1 /100 | #281 | Tragic $74,896 |
| Central American Indians | 0.1 /100 | #282 | Tragic $74,847 |
| Cree | 0.1 /100 | #283 | Tragic $74,685 |
| Yaqui | 0.1 /100 | #284 | Tragic $74,596 |
| Mexicans | 0.1 /100 | #285 | Tragic $74,399 |