Portuguese vs Kenyan Median Household Income
COMPARE
Portuguese
Kenyan
Median Household Income
Median Household Income Comparison
Portuguese
Kenyans
$88,976
MEDIAN HOUSEHOLD INCOME
92.3/ 100
METRIC RATING
128th/ 347
METRIC RANK
$84,085
MEDIAN HOUSEHOLD INCOME
34.2/ 100
METRIC RATING
185th/ 347
METRIC RANK
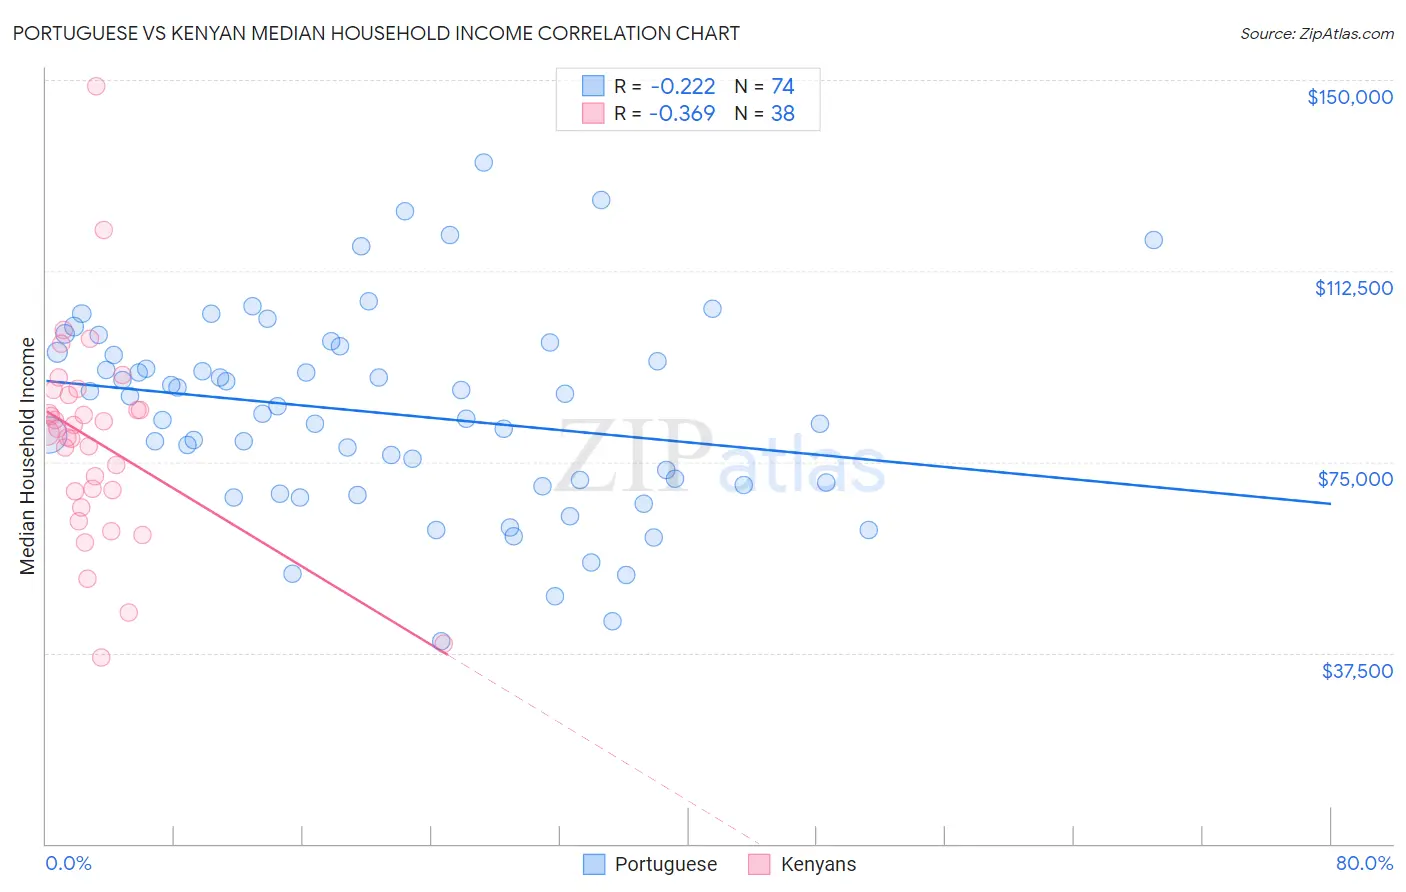
Portuguese vs Kenyan Median Household Income Correlation Chart
The statistical analysis conducted on geographies consisting of 449,847,647 people shows a weak negative correlation between the proportion of Portuguese and median household income in the United States with a correlation coefficient (R) of -0.222 and weighted average of $88,976. Similarly, the statistical analysis conducted on geographies consisting of 168,121,299 people shows a mild negative correlation between the proportion of Kenyans and median household income in the United States with a correlation coefficient (R) of -0.369 and weighted average of $84,085, a difference of 5.8%.
Median Household Income Correlation Summary
| Measurement | Portuguese | Kenyan |
| Minimum | $39,715 | $36,467 |
| Maximum | $133,721 | $148,810 |
| Range | $94,006 | $112,343 |
| Mean | $84,548 | $79,073 |
| Median | $85,247 | $81,160 |
| Interquartile 25% (IQ1) | $70,338 | $69,173 |
| Interquartile 75% (IQ3) | $96,551 | $88,022 |
| Interquartile Range (IQR) | $26,213 | $18,850 |
| Standard Deviation (Sample) | $19,508 | $20,616 |
| Standard Deviation (Population) | $19,376 | $20,343 |
Similar Demographics by Median Household Income
Demographics Similar to Portuguese by Median Household Income
In terms of median household income, the demographic groups most similar to Portuguese are Immigrants from Peru ($89,010, a difference of 0.040%), Brazilian ($88,934, a difference of 0.050%), British ($88,914, a difference of 0.070%), Immigrants from Oceania ($89,100, a difference of 0.14%), and Immigrants from Syria ($88,792, a difference of 0.21%).
| Demographics | Rating | Rank | Median Household Income |
| Ethiopians | 94.9 /100 | #121 | Exceptional $89,640 |
| Pakistanis | 94.8 /100 | #122 | Exceptional $89,638 |
| Immigrants | Zimbabwe | 94.4 /100 | #123 | Exceptional $89,496 |
| Immigrants | Jordan | 94.1 /100 | #124 | Exceptional $89,412 |
| Immigrants | Kuwait | 93.5 /100 | #125 | Exceptional $89,263 |
| Immigrants | Oceania | 92.9 /100 | #126 | Exceptional $89,100 |
| Immigrants | Peru | 92.5 /100 | #127 | Exceptional $89,010 |
| Portuguese | 92.3 /100 | #128 | Exceptional $88,976 |
| Brazilians | 92.1 /100 | #129 | Exceptional $88,934 |
| British | 92.0 /100 | #130 | Exceptional $88,914 |
| Immigrants | Syria | 91.4 /100 | #131 | Exceptional $88,792 |
| Europeans | 91.2 /100 | #132 | Exceptional $88,751 |
| Immigrants | Ethiopia | 90.9 /100 | #133 | Exceptional $88,687 |
| Swedes | 90.0 /100 | #134 | Exceptional $88,524 |
| Immigrants | Sierra Leone | 89.9 /100 | #135 | Excellent $88,498 |
Demographics Similar to Kenyans by Median Household Income
In terms of median household income, the demographic groups most similar to Kenyans are Puget Sound Salish ($84,011, a difference of 0.090%), Belgian ($84,008, a difference of 0.090%), Tlingit-Haida ($83,968, a difference of 0.14%), Immigrants from Colombia ($83,902, a difference of 0.22%), and Immigrants from Eastern Africa ($84,299, a difference of 0.25%).
| Demographics | Rating | Rank | Median Household Income |
| Czechoslovakians | 47.8 /100 | #178 | Average $84,965 |
| English | 47.0 /100 | #179 | Average $84,915 |
| Immigrants | Portugal | 44.2 /100 | #180 | Average $84,740 |
| Hawaiians | 44.1 /100 | #181 | Average $84,729 |
| Uruguayans | 43.5 /100 | #182 | Average $84,691 |
| Spaniards | 42.7 /100 | #183 | Average $84,644 |
| Immigrants | Eastern Africa | 37.4 /100 | #184 | Fair $84,299 |
| Kenyans | 34.2 /100 | #185 | Fair $84,085 |
| Puget Sound Salish | 33.2 /100 | #186 | Fair $84,011 |
| Belgians | 33.2 /100 | #187 | Fair $84,008 |
| Tlingit-Haida | 32.6 /100 | #188 | Fair $83,968 |
| Immigrants | Colombia | 31.7 /100 | #189 | Fair $83,902 |
| Slovaks | 30.2 /100 | #190 | Fair $83,798 |
| Iraqis | 29.6 /100 | #191 | Fair $83,753 |
| Welsh | 28.0 /100 | #192 | Fair $83,628 |