Immigrants from Sierra Leone vs Immigrants from Singapore Median Male Earnings
COMPARE
Immigrants from Sierra Leone
Immigrants from Singapore
Median Male Earnings
Median Male Earnings Comparison
Immigrants from Sierra Leone
Immigrants from Singapore
$53,905
MEDIAN MALE EARNINGS
36.0/ 100
METRIC RATING
185th/ 347
METRIC RANK
$71,348
MEDIAN MALE EARNINGS
100.0/ 100
METRIC RATING
5th/ 347
METRIC RANK
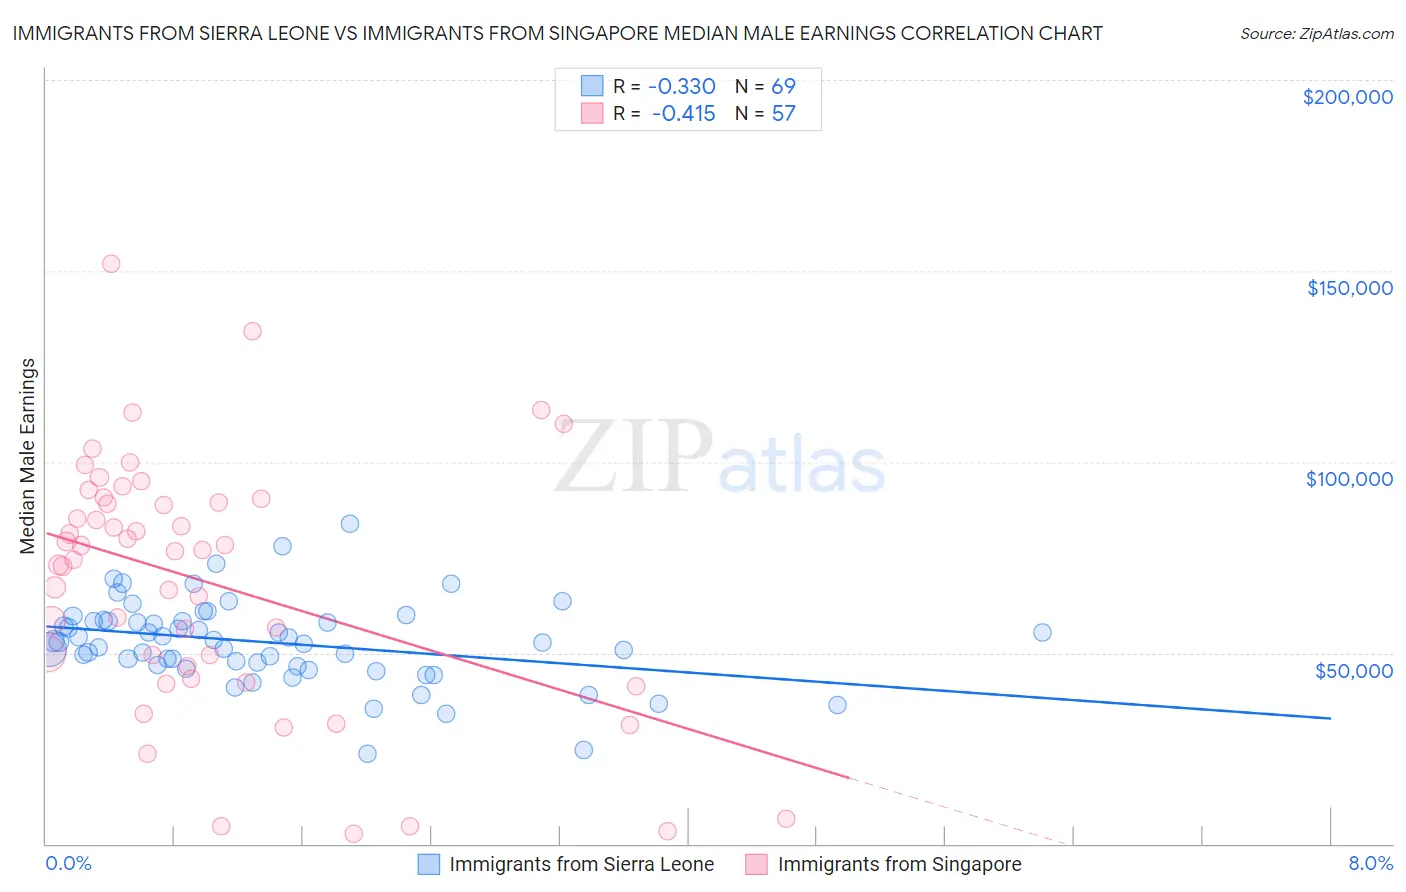
Immigrants from Sierra Leone vs Immigrants from Singapore Median Male Earnings Correlation Chart
The statistical analysis conducted on geographies consisting of 101,648,360 people shows a mild negative correlation between the proportion of Immigrants from Sierra Leone and median male earnings in the United States with a correlation coefficient (R) of -0.330 and weighted average of $53,905. Similarly, the statistical analysis conducted on geographies consisting of 137,517,070 people shows a moderate negative correlation between the proportion of Immigrants from Singapore and median male earnings in the United States with a correlation coefficient (R) of -0.415 and weighted average of $71,348, a difference of 32.4%.
Median Male Earnings Correlation Summary
| Measurement | Immigrants from Sierra Leone | Immigrants from Singapore |
| Minimum | $23,693 | $2,499 |
| Maximum | $83,830 | $151,839 |
| Range | $60,137 | $149,340 |
| Mean | $52,734 | $68,476 |
| Median | $52,856 | $76,629 |
| Interquartile 25% (IQ1) | $46,657 | $44,952 |
| Interquartile 75% (IQ3) | $58,267 | $89,757 |
| Interquartile Range (IQR) | $11,610 | $44,804 |
| Standard Deviation (Sample) | $10,929 | $32,686 |
| Standard Deviation (Population) | $10,849 | $32,398 |
Similar Demographics by Median Male Earnings
Demographics Similar to Immigrants from Sierra Leone by Median Male Earnings
In terms of median male earnings, the demographic groups most similar to Immigrants from Sierra Leone are White/Caucasian ($53,925, a difference of 0.040%), Yugoslavian ($53,967, a difference of 0.11%), Immigrants from South America ($53,962, a difference of 0.11%), Colombian ($53,832, a difference of 0.14%), and Immigrants from Eritrea ($53,715, a difference of 0.35%).
| Demographics | Rating | Rank | Median Male Earnings |
| Sierra Leoneans | 44.8 /100 | #178 | Average $54,279 |
| Celtics | 43.9 /100 | #179 | Average $54,242 |
| Iraqis | 42.5 /100 | #180 | Average $54,182 |
| Immigrants | Immigrants | 42.1 /100 | #181 | Average $54,168 |
| Yugoslavians | 37.4 /100 | #182 | Fair $53,967 |
| Immigrants | South America | 37.3 /100 | #183 | Fair $53,962 |
| Whites/Caucasians | 36.5 /100 | #184 | Fair $53,925 |
| Immigrants | Sierra Leone | 36.0 /100 | #185 | Fair $53,905 |
| Colombians | 34.4 /100 | #186 | Fair $53,832 |
| Immigrants | Eritrea | 31.8 /100 | #187 | Fair $53,715 |
| Immigrants | Eastern Africa | 31.8 /100 | #188 | Fair $53,713 |
| Puget Sound Salish | 31.6 /100 | #189 | Fair $53,704 |
| Uruguayans | 31.1 /100 | #190 | Fair $53,680 |
| Guamanians/Chamorros | 30.7 /100 | #191 | Fair $53,661 |
| Scotch-Irish | 30.6 /100 | #192 | Fair $53,658 |
Demographics Similar to Immigrants from Singapore by Median Male Earnings
In terms of median male earnings, the demographic groups most similar to Immigrants from Singapore are Iranian ($70,648, a difference of 0.99%), Thai ($72,135, a difference of 1.1%), Immigrants from Hong Kong ($70,146, a difference of 1.7%), Immigrants from Iran ($69,284, a difference of 3.0%), and Immigrants from South Central Asia ($68,960, a difference of 3.5%).
| Demographics | Rating | Rank | Median Male Earnings |
| Filipinos | 100.0 /100 | #1 | Exceptional $74,224 |
| Immigrants | India | 100.0 /100 | #2 | Exceptional $74,207 |
| Immigrants | Taiwan | 100.0 /100 | #3 | Exceptional $74,031 |
| Thais | 100.0 /100 | #4 | Exceptional $72,135 |
| Immigrants | Singapore | 100.0 /100 | #5 | Exceptional $71,348 |
| Iranians | 100.0 /100 | #6 | Exceptional $70,648 |
| Immigrants | Hong Kong | 100.0 /100 | #7 | Exceptional $70,146 |
| Immigrants | Iran | 100.0 /100 | #8 | Exceptional $69,284 |
| Immigrants | South Central Asia | 100.0 /100 | #9 | Exceptional $68,960 |
| Immigrants | Israel | 100.0 /100 | #10 | Exceptional $68,716 |
| Immigrants | Ireland | 100.0 /100 | #11 | Exceptional $67,698 |
| Immigrants | Australia | 100.0 /100 | #12 | Exceptional $67,634 |
| Immigrants | China | 100.0 /100 | #13 | Exceptional $67,353 |
| Okinawans | 100.0 /100 | #14 | Exceptional $67,232 |
| Immigrants | Eastern Asia | 100.0 /100 | #15 | Exceptional $66,903 |