American vs Mexican Median Male Earnings
COMPARE
American
Mexican
Median Male Earnings
Median Male Earnings Comparison
Americans
Mexicans
$50,761
MEDIAN MALE EARNINGS
2.5/ 100
METRIC RATING
239th/ 347
METRIC RANK
$46,147
MEDIAN MALE EARNINGS
0.0/ 100
METRIC RATING
317th/ 347
METRIC RANK
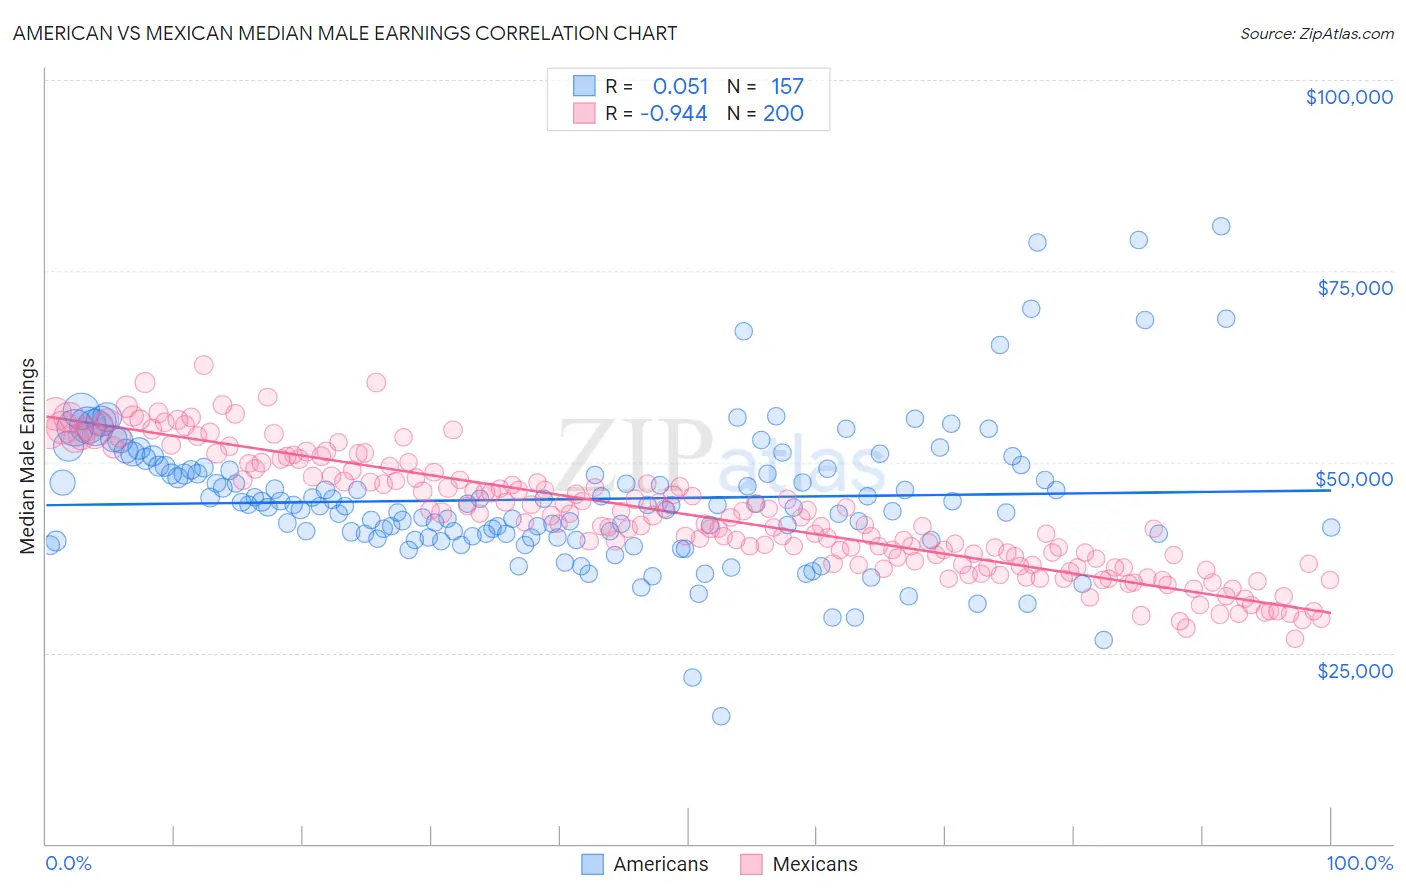
American vs Mexican Median Male Earnings Correlation Chart
The statistical analysis conducted on geographies consisting of 580,042,530 people shows a slight positive correlation between the proportion of Americans and median male earnings in the United States with a correlation coefficient (R) of 0.051 and weighted average of $50,761. Similarly, the statistical analysis conducted on geographies consisting of 564,183,218 people shows a near-perfect negative correlation between the proportion of Mexicans and median male earnings in the United States with a correlation coefficient (R) of -0.944 and weighted average of $46,147, a difference of 10.0%.
Median Male Earnings Correlation Summary
| Measurement | American | Mexican |
| Minimum | $16,756 | $26,771 |
| Maximum | $80,855 | $62,671 |
| Range | $64,099 | $35,900 |
| Mean | $45,104 | $43,079 |
| Median | $44,329 | $42,356 |
| Interquartile 25% (IQ1) | $40,142 | $36,668 |
| Interquartile 75% (IQ3) | $48,927 | $48,978 |
| Interquartile Range (IQR) | $8,785 | $12,309 |
| Standard Deviation (Sample) | $9,213 | $7,897 |
| Standard Deviation (Population) | $9,183 | $7,878 |
Similar Demographics by Median Male Earnings
Demographics Similar to Americans by Median Male Earnings
In terms of median male earnings, the demographic groups most similar to Americans are Malaysian ($50,772, a difference of 0.020%), Immigrants from Barbados ($50,795, a difference of 0.070%), West Indian ($50,682, a difference of 0.16%), Immigrants from St. Vincent and the Grenadines ($50,665, a difference of 0.19%), and Pennsylvania German ($50,878, a difference of 0.23%).
| Demographics | Rating | Rank | Median Male Earnings |
| Sudanese | 3.9 /100 | #232 | Tragic $51,216 |
| Aleuts | 3.7 /100 | #233 | Tragic $51,168 |
| Cape Verdeans | 3.5 /100 | #234 | Tragic $51,103 |
| Immigrants | Western Africa | 3.0 /100 | #235 | Tragic $50,940 |
| Pennsylvania Germans | 2.8 /100 | #236 | Tragic $50,878 |
| Immigrants | Barbados | 2.6 /100 | #237 | Tragic $50,795 |
| Malaysians | 2.5 /100 | #238 | Tragic $50,772 |
| Americans | 2.5 /100 | #239 | Tragic $50,761 |
| West Indians | 2.3 /100 | #240 | Tragic $50,682 |
| Immigrants | St. Vincent and the Grenadines | 2.3 /100 | #241 | Tragic $50,665 |
| Guyanese | 2.2 /100 | #242 | Tragic $50,613 |
| French American Indians | 2.2 /100 | #243 | Tragic $50,611 |
| Houma | 2.0 /100 | #244 | Tragic $50,547 |
| Hawaiians | 1.9 /100 | #245 | Tragic $50,488 |
| Immigrants | Ecuador | 1.9 /100 | #246 | Tragic $50,474 |
Demographics Similar to Mexicans by Median Male Earnings
In terms of median male earnings, the demographic groups most similar to Mexicans are Immigrants from Caribbean ($46,193, a difference of 0.10%), Cheyenne ($46,062, a difference of 0.18%), Immigrants from Guatemala ($46,244, a difference of 0.21%), Chippewa ($46,368, a difference of 0.48%), and Honduran ($46,374, a difference of 0.49%).
| Demographics | Rating | Rank | Median Male Earnings |
| Cubans | 0.0 /100 | #310 | Tragic $46,580 |
| Apache | 0.0 /100 | #311 | Tragic $46,429 |
| Hispanics or Latinos | 0.0 /100 | #312 | Tragic $46,419 |
| Hondurans | 0.0 /100 | #313 | Tragic $46,374 |
| Chippewa | 0.0 /100 | #314 | Tragic $46,368 |
| Immigrants | Guatemala | 0.0 /100 | #315 | Tragic $46,244 |
| Immigrants | Caribbean | 0.0 /100 | #316 | Tragic $46,193 |
| Mexicans | 0.0 /100 | #317 | Tragic $46,147 |
| Cheyenne | 0.0 /100 | #318 | Tragic $46,062 |
| Haitians | 0.0 /100 | #319 | Tragic $45,903 |
| Immigrants | Honduras | 0.0 /100 | #320 | Tragic $45,787 |
| Fijians | 0.0 /100 | #321 | Tragic $45,607 |
| Sioux | 0.0 /100 | #322 | Tragic $45,566 |
| Immigrants | Central America | 0.0 /100 | #323 | Tragic $45,538 |
| Blacks/African Americans | 0.0 /100 | #324 | Tragic $45,523 |