American vs French Median Male Earnings
COMPARE
American
French
Median Male Earnings
Median Male Earnings Comparison
Americans
French
$50,761
MEDIAN MALE EARNINGS
2.5/ 100
METRIC RATING
239th/ 347
METRIC RANK
$55,350
MEDIAN MALE EARNINGS
69.9/ 100
METRIC RATING
162nd/ 347
METRIC RANK
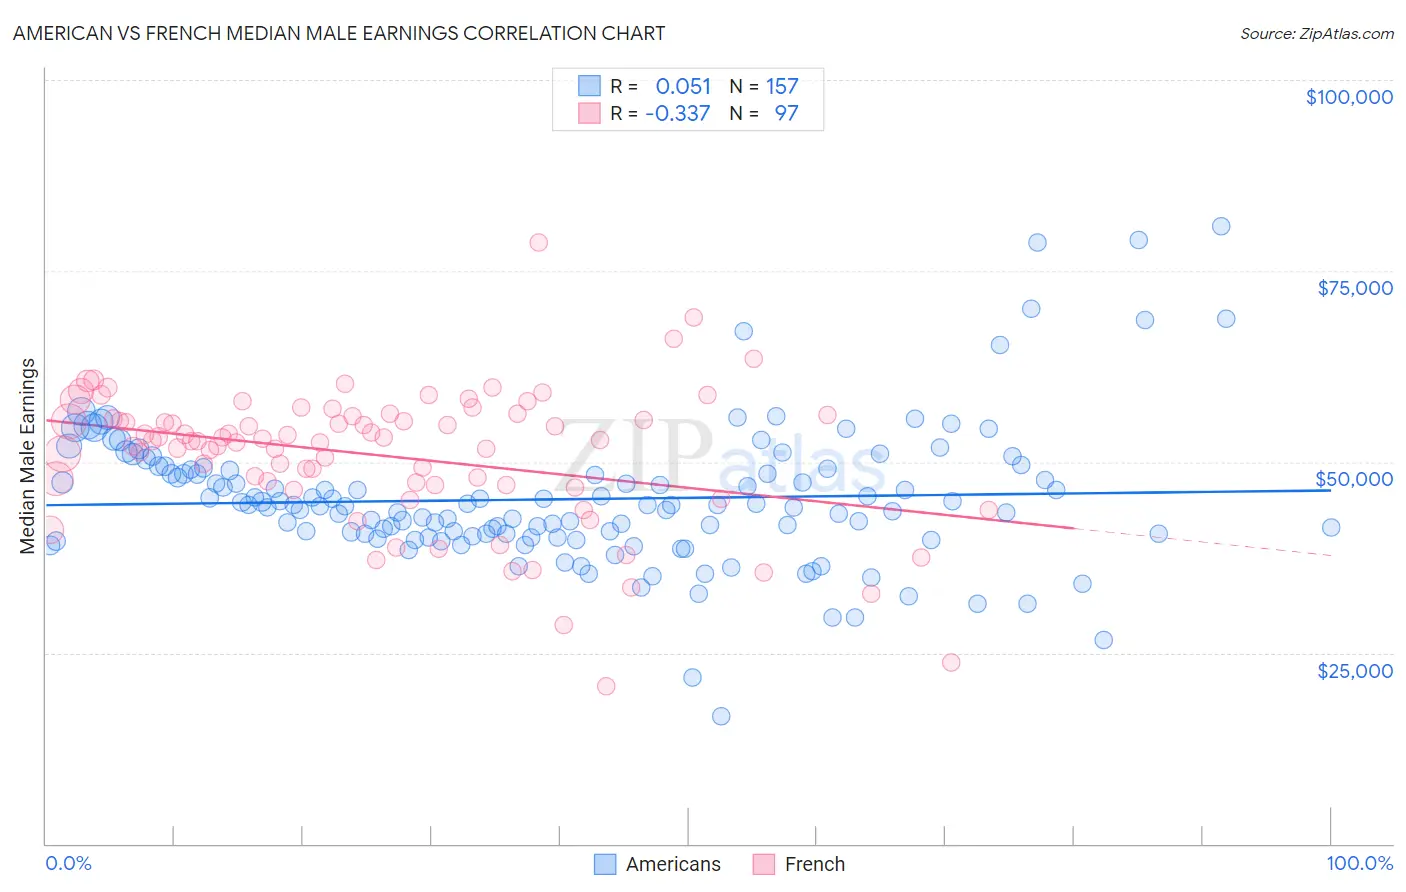
American vs French Median Male Earnings Correlation Chart
The statistical analysis conducted on geographies consisting of 580,042,530 people shows a slight positive correlation between the proportion of Americans and median male earnings in the United States with a correlation coefficient (R) of 0.051 and weighted average of $50,761. Similarly, the statistical analysis conducted on geographies consisting of 571,095,815 people shows a mild negative correlation between the proportion of French and median male earnings in the United States with a correlation coefficient (R) of -0.337 and weighted average of $55,350, a difference of 9.0%.
Median Male Earnings Correlation Summary
| Measurement | American | French |
| Minimum | $16,756 | $20,556 |
| Maximum | $80,855 | $78,663 |
| Range | $64,099 | $58,107 |
| Mean | $45,104 | $50,816 |
| Median | $44,329 | $52,806 |
| Interquartile 25% (IQ1) | $40,142 | $46,933 |
| Interquartile 75% (IQ3) | $48,927 | $56,096 |
| Interquartile Range (IQR) | $8,785 | $9,162 |
| Standard Deviation (Sample) | $9,213 | $9,122 |
| Standard Deviation (Population) | $9,183 | $9,075 |
Similar Demographics by Median Male Earnings
Demographics Similar to Americans by Median Male Earnings
In terms of median male earnings, the demographic groups most similar to Americans are Malaysian ($50,772, a difference of 0.020%), Immigrants from Barbados ($50,795, a difference of 0.070%), West Indian ($50,682, a difference of 0.16%), Immigrants from St. Vincent and the Grenadines ($50,665, a difference of 0.19%), and Pennsylvania German ($50,878, a difference of 0.23%).
| Demographics | Rating | Rank | Median Male Earnings |
| Sudanese | 3.9 /100 | #232 | Tragic $51,216 |
| Aleuts | 3.7 /100 | #233 | Tragic $51,168 |
| Cape Verdeans | 3.5 /100 | #234 | Tragic $51,103 |
| Immigrants | Western Africa | 3.0 /100 | #235 | Tragic $50,940 |
| Pennsylvania Germans | 2.8 /100 | #236 | Tragic $50,878 |
| Immigrants | Barbados | 2.6 /100 | #237 | Tragic $50,795 |
| Malaysians | 2.5 /100 | #238 | Tragic $50,772 |
| Americans | 2.5 /100 | #239 | Tragic $50,761 |
| West Indians | 2.3 /100 | #240 | Tragic $50,682 |
| Immigrants | St. Vincent and the Grenadines | 2.3 /100 | #241 | Tragic $50,665 |
| Guyanese | 2.2 /100 | #242 | Tragic $50,613 |
| French American Indians | 2.2 /100 | #243 | Tragic $50,611 |
| Houma | 2.0 /100 | #244 | Tragic $50,547 |
| Hawaiians | 1.9 /100 | #245 | Tragic $50,488 |
| Immigrants | Ecuador | 1.9 /100 | #246 | Tragic $50,474 |
Demographics Similar to French by Median Male Earnings
In terms of median male earnings, the demographic groups most similar to French are Belgian ($55,361, a difference of 0.020%), Basque ($55,370, a difference of 0.040%), Alsatian ($55,380, a difference of 0.050%), Czechoslovakian ($55,382, a difference of 0.060%), and Ugandan ($55,290, a difference of 0.11%).
| Demographics | Rating | Rank | Median Male Earnings |
| Scandinavians | 73.4 /100 | #155 | Good $55,527 |
| Immigrants | Ethiopia | 71.6 /100 | #156 | Good $55,434 |
| Icelanders | 71.2 /100 | #157 | Good $55,415 |
| Czechoslovakians | 70.5 /100 | #158 | Good $55,382 |
| Alsatians | 70.5 /100 | #159 | Good $55,380 |
| Basques | 70.3 /100 | #160 | Good $55,370 |
| Belgians | 70.1 /100 | #161 | Good $55,361 |
| French | 69.9 /100 | #162 | Good $55,350 |
| Ugandans | 68.6 /100 | #163 | Good $55,290 |
| Immigrants | South Eastern Asia | 67.6 /100 | #164 | Good $55,241 |
| Immigrants | Portugal | 66.3 /100 | #165 | Good $55,182 |
| Germans | 61.6 /100 | #166 | Good $54,974 |
| Immigrants | Fiji | 61.2 /100 | #167 | Good $54,958 |
| Immigrants | Vietnam | 60.2 /100 | #168 | Good $54,913 |
| French Canadians | 55.6 /100 | #169 | Average $54,722 |