Maltese vs Immigrants from Singapore Median Male Earnings
COMPARE
Maltese
Immigrants from Singapore
Median Male Earnings
Median Male Earnings Comparison
Maltese
Immigrants from Singapore
$62,953
MEDIAN MALE EARNINGS
100.0/ 100
METRIC RATING
38th/ 347
METRIC RANK
$71,348
MEDIAN MALE EARNINGS
100.0/ 100
METRIC RATING
5th/ 347
METRIC RANK
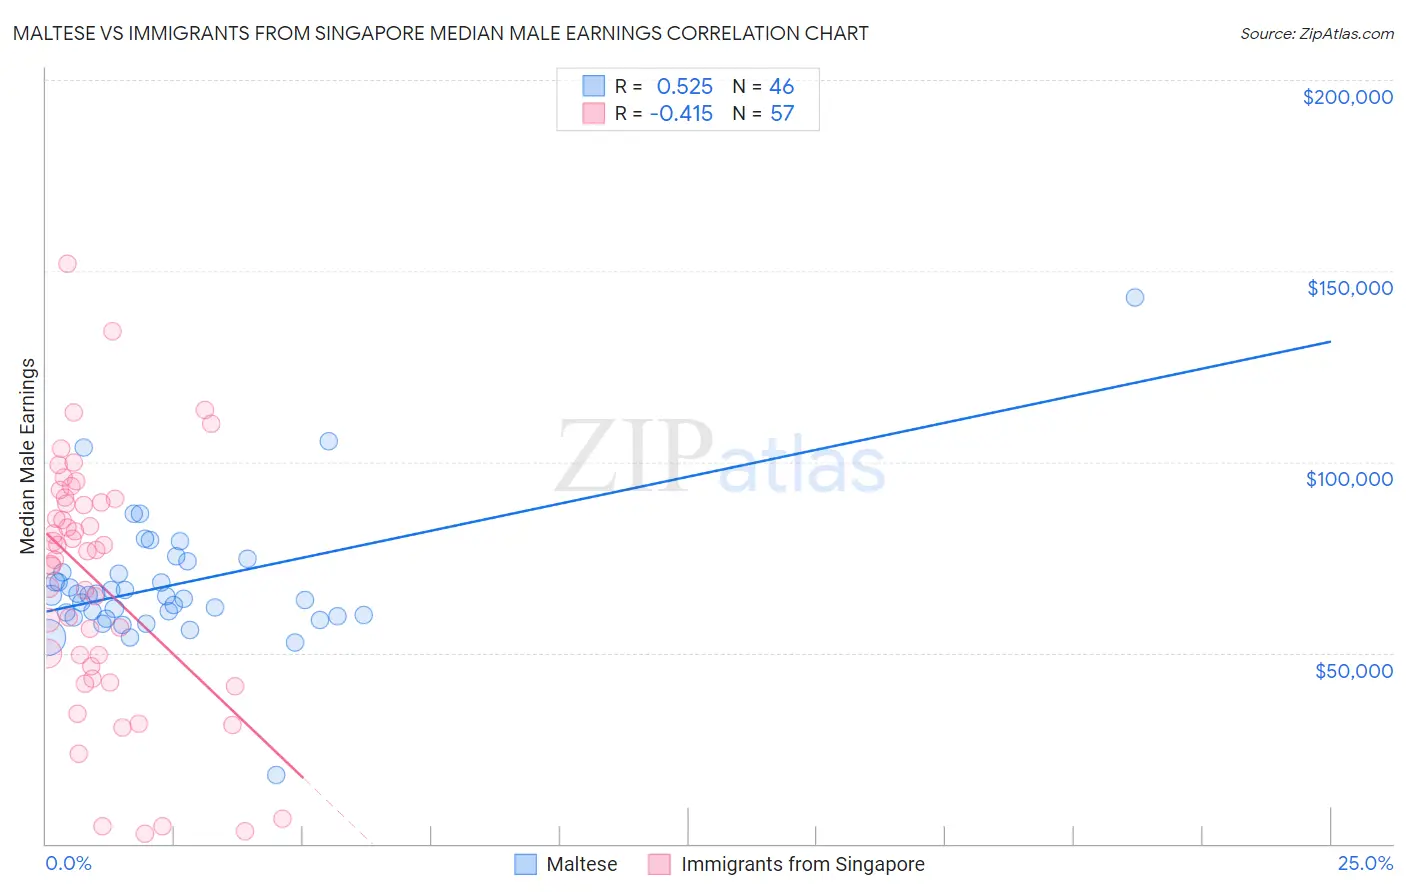
Maltese vs Immigrants from Singapore Median Male Earnings Correlation Chart
The statistical analysis conducted on geographies consisting of 126,470,445 people shows a substantial positive correlation between the proportion of Maltese and median male earnings in the United States with a correlation coefficient (R) of 0.525 and weighted average of $62,953. Similarly, the statistical analysis conducted on geographies consisting of 137,517,070 people shows a moderate negative correlation between the proportion of Immigrants from Singapore and median male earnings in the United States with a correlation coefficient (R) of -0.415 and weighted average of $71,348, a difference of 13.3%.
Median Male Earnings Correlation Summary
| Measurement | Maltese | Immigrants from Singapore |
| Minimum | $17,917 | $2,499 |
| Maximum | $143,125 | $151,839 |
| Range | $125,208 | $149,340 |
| Mean | $67,890 | $68,476 |
| Median | $64,879 | $76,629 |
| Interquartile 25% (IQ1) | $59,600 | $44,952 |
| Interquartile 75% (IQ3) | $71,008 | $89,757 |
| Interquartile Range (IQR) | $11,408 | $44,804 |
| Standard Deviation (Sample) | $17,590 | $32,686 |
| Standard Deviation (Population) | $17,397 | $32,398 |
Similar Demographics by Median Male Earnings
Demographics Similar to Maltese by Median Male Earnings
In terms of median male earnings, the demographic groups most similar to Maltese are Immigrants from South Africa ($62,899, a difference of 0.090%), Australian ($62,857, a difference of 0.15%), Immigrants from Sri Lanka ($63,099, a difference of 0.23%), Immigrants from Turkey ($62,728, a difference of 0.36%), and Immigrants from Greece ($62,689, a difference of 0.42%).
| Demographics | Rating | Rank | Median Male Earnings |
| Latvians | 100.0 /100 | #31 | Exceptional $63,498 |
| Soviet Union | 100.0 /100 | #32 | Exceptional $63,382 |
| Immigrants | Lithuania | 100.0 /100 | #33 | Exceptional $63,346 |
| Immigrants | Russia | 100.0 /100 | #34 | Exceptional $63,326 |
| Immigrants | Asia | 100.0 /100 | #35 | Exceptional $63,240 |
| Israelis | 100.0 /100 | #36 | Exceptional $63,228 |
| Immigrants | Sri Lanka | 100.0 /100 | #37 | Exceptional $63,099 |
| Maltese | 100.0 /100 | #38 | Exceptional $62,953 |
| Immigrants | South Africa | 100.0 /100 | #39 | Exceptional $62,899 |
| Australians | 100.0 /100 | #40 | Exceptional $62,857 |
| Immigrants | Turkey | 100.0 /100 | #41 | Exceptional $62,728 |
| Immigrants | Greece | 100.0 /100 | #42 | Exceptional $62,689 |
| Immigrants | Belarus | 100.0 /100 | #43 | Exceptional $62,658 |
| Cambodians | 100.0 /100 | #44 | Exceptional $62,516 |
| Bulgarians | 100.0 /100 | #45 | Exceptional $62,378 |
Demographics Similar to Immigrants from Singapore by Median Male Earnings
In terms of median male earnings, the demographic groups most similar to Immigrants from Singapore are Iranian ($70,648, a difference of 0.99%), Thai ($72,135, a difference of 1.1%), Immigrants from Hong Kong ($70,146, a difference of 1.7%), Immigrants from Iran ($69,284, a difference of 3.0%), and Immigrants from South Central Asia ($68,960, a difference of 3.5%).
| Demographics | Rating | Rank | Median Male Earnings |
| Filipinos | 100.0 /100 | #1 | Exceptional $74,224 |
| Immigrants | India | 100.0 /100 | #2 | Exceptional $74,207 |
| Immigrants | Taiwan | 100.0 /100 | #3 | Exceptional $74,031 |
| Thais | 100.0 /100 | #4 | Exceptional $72,135 |
| Immigrants | Singapore | 100.0 /100 | #5 | Exceptional $71,348 |
| Iranians | 100.0 /100 | #6 | Exceptional $70,648 |
| Immigrants | Hong Kong | 100.0 /100 | #7 | Exceptional $70,146 |
| Immigrants | Iran | 100.0 /100 | #8 | Exceptional $69,284 |
| Immigrants | South Central Asia | 100.0 /100 | #9 | Exceptional $68,960 |
| Immigrants | Israel | 100.0 /100 | #10 | Exceptional $68,716 |
| Immigrants | Ireland | 100.0 /100 | #11 | Exceptional $67,698 |
| Immigrants | Australia | 100.0 /100 | #12 | Exceptional $67,634 |
| Immigrants | China | 100.0 /100 | #13 | Exceptional $67,353 |
| Okinawans | 100.0 /100 | #14 | Exceptional $67,232 |
| Immigrants | Eastern Asia | 100.0 /100 | #15 | Exceptional $66,903 |