Immigrants from Caribbean vs Immigrants from Singapore Median Male Earnings
COMPARE
Immigrants from Caribbean
Immigrants from Singapore
Median Male Earnings
Median Male Earnings Comparison
Immigrants from Caribbean
Immigrants from Singapore
$46,193
MEDIAN MALE EARNINGS
0.0/ 100
METRIC RATING
316th/ 347
METRIC RANK
$71,348
MEDIAN MALE EARNINGS
100.0/ 100
METRIC RATING
5th/ 347
METRIC RANK
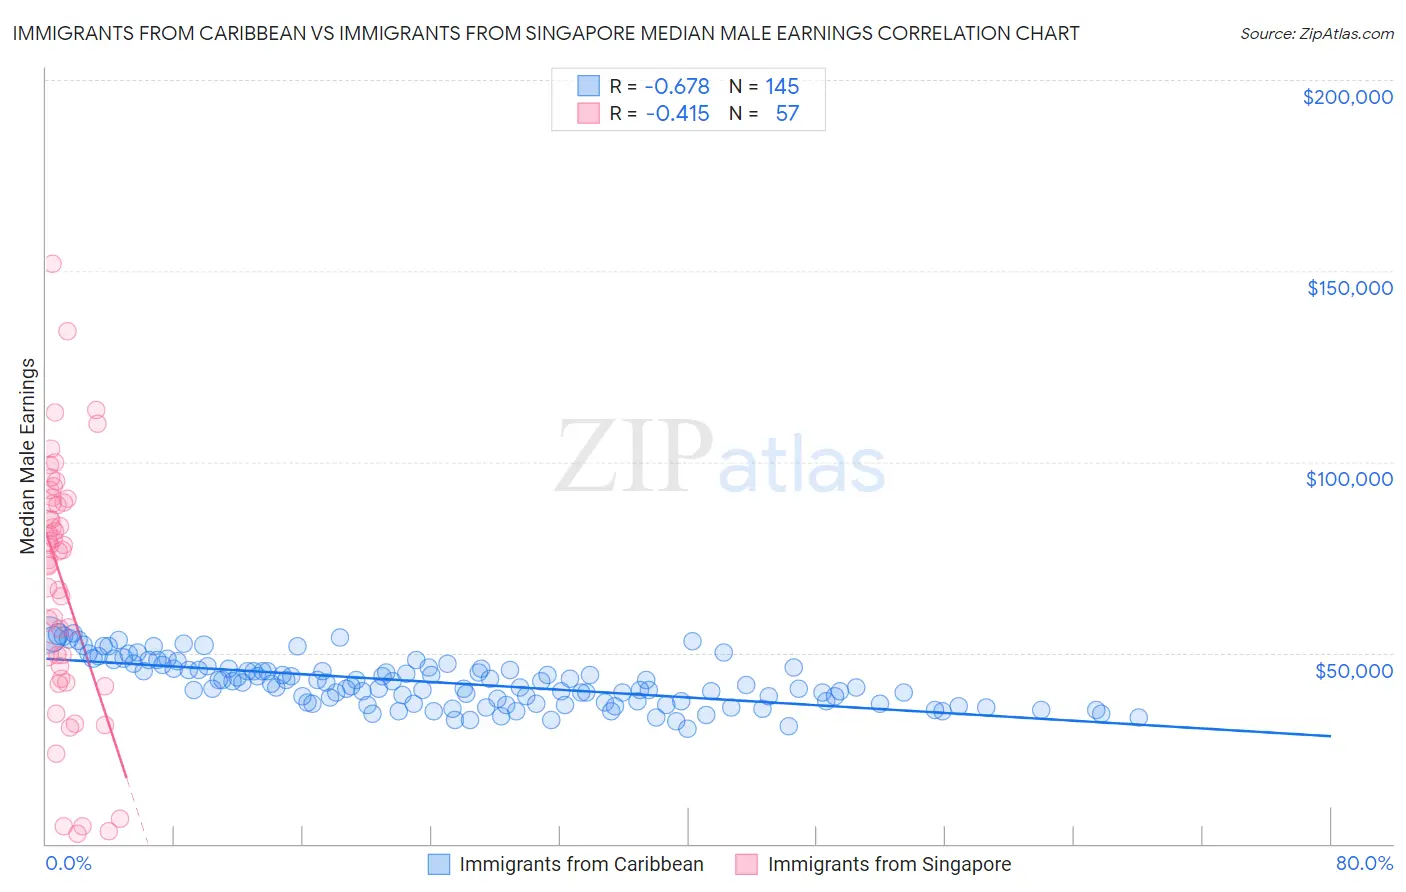
Immigrants from Caribbean vs Immigrants from Singapore Median Male Earnings Correlation Chart
The statistical analysis conducted on geographies consisting of 449,789,932 people shows a significant negative correlation between the proportion of Immigrants from Caribbean and median male earnings in the United States with a correlation coefficient (R) of -0.678 and weighted average of $46,193. Similarly, the statistical analysis conducted on geographies consisting of 137,517,070 people shows a moderate negative correlation between the proportion of Immigrants from Singapore and median male earnings in the United States with a correlation coefficient (R) of -0.415 and weighted average of $71,348, a difference of 54.5%.
Median Male Earnings Correlation Summary
| Measurement | Immigrants from Caribbean | Immigrants from Singapore |
| Minimum | $30,010 | $2,499 |
| Maximum | $55,142 | $151,839 |
| Range | $25,132 | $149,340 |
| Mean | $42,215 | $68,476 |
| Median | $41,809 | $76,629 |
| Interquartile 25% (IQ1) | $37,054 | $44,952 |
| Interquartile 75% (IQ3) | $46,037 | $89,757 |
| Interquartile Range (IQR) | $8,984 | $44,804 |
| Standard Deviation (Sample) | $6,100 | $32,686 |
| Standard Deviation (Population) | $6,079 | $32,398 |
Similar Demographics by Median Male Earnings
Demographics Similar to Immigrants from Caribbean by Median Male Earnings
In terms of median male earnings, the demographic groups most similar to Immigrants from Caribbean are Mexican ($46,147, a difference of 0.10%), Immigrants from Guatemala ($46,244, a difference of 0.11%), Cheyenne ($46,062, a difference of 0.28%), Chippewa ($46,368, a difference of 0.38%), and Honduran ($46,374, a difference of 0.39%).
| Demographics | Rating | Rank | Median Male Earnings |
| Creek | 0.0 /100 | #309 | Tragic $46,594 |
| Cubans | 0.0 /100 | #310 | Tragic $46,580 |
| Apache | 0.0 /100 | #311 | Tragic $46,429 |
| Hispanics or Latinos | 0.0 /100 | #312 | Tragic $46,419 |
| Hondurans | 0.0 /100 | #313 | Tragic $46,374 |
| Chippewa | 0.0 /100 | #314 | Tragic $46,368 |
| Immigrants | Guatemala | 0.0 /100 | #315 | Tragic $46,244 |
| Immigrants | Caribbean | 0.0 /100 | #316 | Tragic $46,193 |
| Mexicans | 0.0 /100 | #317 | Tragic $46,147 |
| Cheyenne | 0.0 /100 | #318 | Tragic $46,062 |
| Haitians | 0.0 /100 | #319 | Tragic $45,903 |
| Immigrants | Honduras | 0.0 /100 | #320 | Tragic $45,787 |
| Fijians | 0.0 /100 | #321 | Tragic $45,607 |
| Sioux | 0.0 /100 | #322 | Tragic $45,566 |
| Immigrants | Central America | 0.0 /100 | #323 | Tragic $45,538 |
Demographics Similar to Immigrants from Singapore by Median Male Earnings
In terms of median male earnings, the demographic groups most similar to Immigrants from Singapore are Iranian ($70,648, a difference of 0.99%), Thai ($72,135, a difference of 1.1%), Immigrants from Hong Kong ($70,146, a difference of 1.7%), Immigrants from Iran ($69,284, a difference of 3.0%), and Immigrants from South Central Asia ($68,960, a difference of 3.5%).
| Demographics | Rating | Rank | Median Male Earnings |
| Filipinos | 100.0 /100 | #1 | Exceptional $74,224 |
| Immigrants | India | 100.0 /100 | #2 | Exceptional $74,207 |
| Immigrants | Taiwan | 100.0 /100 | #3 | Exceptional $74,031 |
| Thais | 100.0 /100 | #4 | Exceptional $72,135 |
| Immigrants | Singapore | 100.0 /100 | #5 | Exceptional $71,348 |
| Iranians | 100.0 /100 | #6 | Exceptional $70,648 |
| Immigrants | Hong Kong | 100.0 /100 | #7 | Exceptional $70,146 |
| Immigrants | Iran | 100.0 /100 | #8 | Exceptional $69,284 |
| Immigrants | South Central Asia | 100.0 /100 | #9 | Exceptional $68,960 |
| Immigrants | Israel | 100.0 /100 | #10 | Exceptional $68,716 |
| Immigrants | Ireland | 100.0 /100 | #11 | Exceptional $67,698 |
| Immigrants | Australia | 100.0 /100 | #12 | Exceptional $67,634 |
| Immigrants | China | 100.0 /100 | #13 | Exceptional $67,353 |
| Okinawans | 100.0 /100 | #14 | Exceptional $67,232 |
| Immigrants | Eastern Asia | 100.0 /100 | #15 | Exceptional $66,903 |