Alsatian vs Immigrants from Turkey In Labor Force | Age 16-19
COMPARE
Alsatian
Immigrants from Turkey
In Labor Force | Age 16-19
In Labor Force | Age 16-19 Comparison
Alsatians
Immigrants from Turkey
35.9%
IN LABOR FORCE | AGE 16-19
17.5/ 100
METRIC RATING
201st/ 347
METRIC RANK
34.9%
IN LABOR FORCE | AGE 16-19
2.6/ 100
METRIC RATING
244th/ 347
METRIC RANK
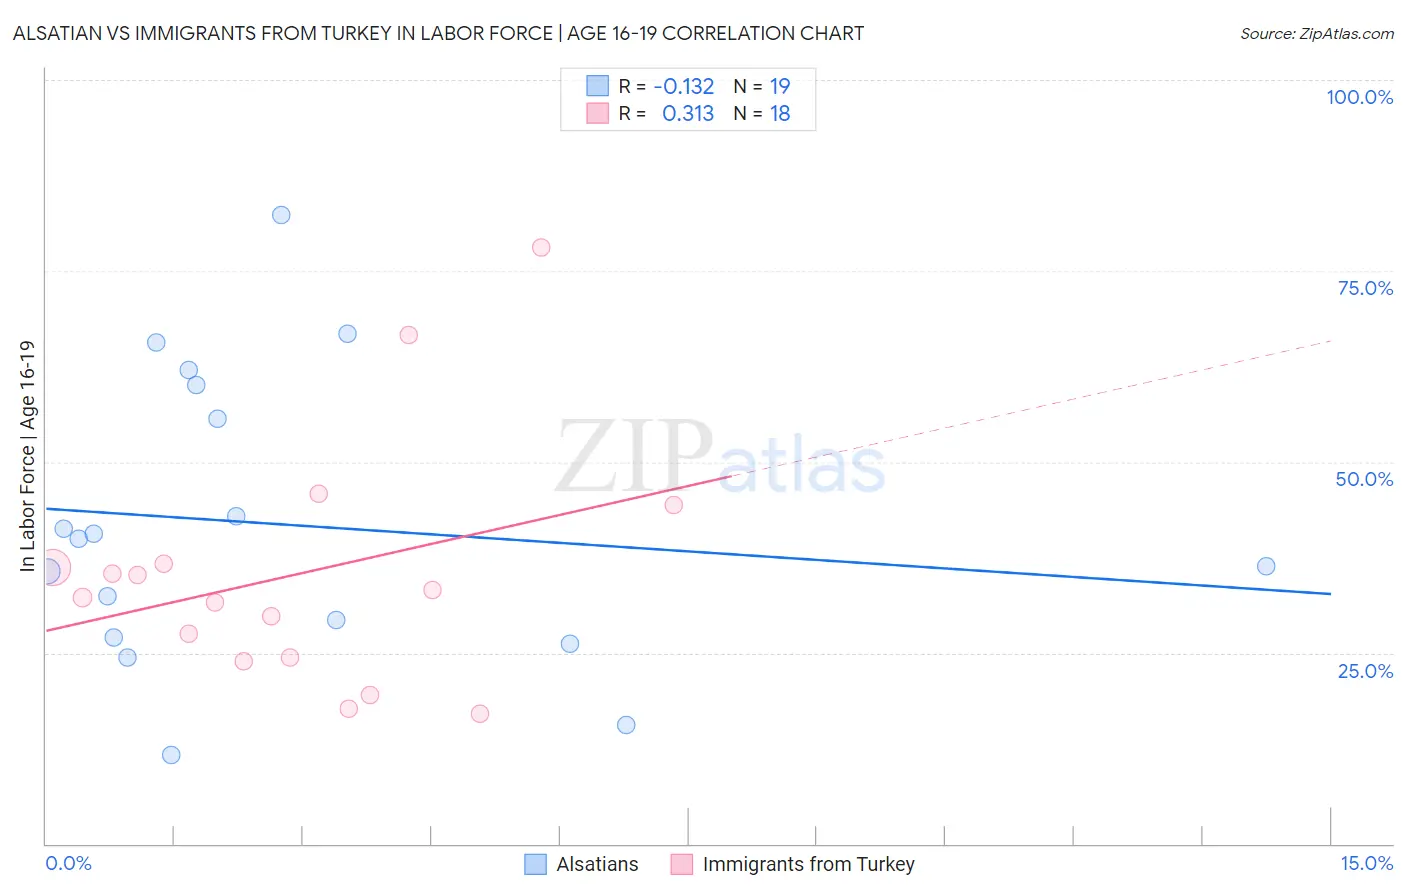
Alsatian vs Immigrants from Turkey In Labor Force | Age 16-19 Correlation Chart
The statistical analysis conducted on geographies consisting of 82,608,203 people shows a poor negative correlation between the proportion of Alsatians and labor force participation rate among population between the ages 16 and 19 in the United States with a correlation coefficient (R) of -0.132 and weighted average of 35.9%. Similarly, the statistical analysis conducted on geographies consisting of 222,808,071 people shows a mild positive correlation between the proportion of Immigrants from Turkey and labor force participation rate among population between the ages 16 and 19 in the United States with a correlation coefficient (R) of 0.313 and weighted average of 34.9%, a difference of 2.8%.
In Labor Force | Age 16-19 Correlation Summary
| Measurement | Alsatian | Immigrants from Turkey |
| Minimum | 11.6% | 17.1% |
| Maximum | 82.4% | 78.1% |
| Range | 70.8% | 61.0% |
| Mean | 41.9% | 35.3% |
| Median | 40.0% | 32.8% |
| Interquartile 25% (IQ1) | 27.0% | 24.3% |
| Interquartile 75% (IQ3) | 60.0% | 36.6% |
| Interquartile Range (IQR) | 33.0% | 12.3% |
| Standard Deviation (Sample) | 18.9% | 15.8% |
| Standard Deviation (Population) | 18.4% | 15.4% |
Similar Demographics by In Labor Force | Age 16-19
Demographics Similar to Alsatians by In Labor Force | Age 16-19
In terms of in labor force | age 16-19, the demographic groups most similar to Alsatians are Senegalese (35.9%, a difference of 0.010%), Immigrants from Nigeria (35.8%, a difference of 0.070%), Immigrants from Sweden (35.9%, a difference of 0.12%), Immigrants from Norway (35.9%, a difference of 0.19%), and Immigrants from Northern Africa (35.9%, a difference of 0.21%).
| Demographics | Rating | Rank | In Labor Force | Age 16-19 |
| Nigerians | 24.6 /100 | #194 | Fair 36.1% |
| Bolivians | 23.3 /100 | #195 | Fair 36.0% |
| Mexican American Indians | 21.1 /100 | #196 | Fair 36.0% |
| Immigrants | Serbia | 21.0 /100 | #197 | Fair 36.0% |
| Immigrants | Northern Africa | 19.9 /100 | #198 | Poor 35.9% |
| Immigrants | Norway | 19.8 /100 | #199 | Poor 35.9% |
| Immigrants | Sweden | 18.8 /100 | #200 | Poor 35.9% |
| Alsatians | 17.5 /100 | #201 | Poor 35.9% |
| Senegalese | 17.4 /100 | #202 | Poor 35.9% |
| Immigrants | Nigeria | 16.8 /100 | #203 | Poor 35.8% |
| Immigrants | Albania | 15.0 /100 | #204 | Poor 35.8% |
| South American Indians | 14.6 /100 | #205 | Poor 35.8% |
| Chileans | 14.6 /100 | #206 | Poor 35.8% |
| Immigrants | Eastern Europe | 14.5 /100 | #207 | Poor 35.8% |
| Koreans | 13.3 /100 | #208 | Poor 35.7% |
Demographics Similar to Immigrants from Turkey by In Labor Force | Age 16-19
In terms of in labor force | age 16-19, the demographic groups most similar to Immigrants from Turkey are Pueblo (34.9%, a difference of 0.020%), Uruguayan (34.9%, a difference of 0.050%), Immigrants from Greece (34.9%, a difference of 0.060%), Immigrants from Sri Lanka (34.9%, a difference of 0.080%), and Laotian (34.9%, a difference of 0.090%).
| Demographics | Rating | Rank | In Labor Force | Age 16-19 |
| Immigrants | India | 3.5 /100 | #237 | Tragic 35.0% |
| Immigrants | Vietnam | 3.4 /100 | #238 | Tragic 35.0% |
| Inupiat | 3.2 /100 | #239 | Tragic 35.0% |
| Immigrants | Central America | 3.0 /100 | #240 | Tragic 35.0% |
| Immigrants | Ireland | 2.9 /100 | #241 | Tragic 35.0% |
| Uruguayans | 2.6 /100 | #242 | Tragic 34.9% |
| Pueblo | 2.6 /100 | #243 | Tragic 34.9% |
| Immigrants | Turkey | 2.6 /100 | #244 | Tragic 34.9% |
| Immigrants | Greece | 2.4 /100 | #245 | Tragic 34.9% |
| Immigrants | Sri Lanka | 2.4 /100 | #246 | Tragic 34.9% |
| Laotians | 2.4 /100 | #247 | Tragic 34.9% |
| Central Americans | 2.2 /100 | #248 | Tragic 34.8% |
| Immigrants | Ukraine | 2.2 /100 | #249 | Tragic 34.8% |
| Immigrants | Pakistan | 2.0 /100 | #250 | Tragic 34.8% |
| Immigrants | Western Asia | 2.0 /100 | #251 | Tragic 34.8% |