Immigrants from Czechoslovakia vs Immigrants from Turkey Wage/Income Gap
COMPARE
Immigrants from Czechoslovakia
Immigrants from Turkey
Wage/Income Gap
Wage/Income Gap Comparison
Immigrants from Czechoslovakia
Immigrants from Turkey
27.3%
WAGE/INCOME GAP
2.7/ 100
METRIC RATING
250th/ 347
METRIC RANK
27.0%
WAGE/INCOME GAP
5.6/ 100
METRIC RATING
228th/ 347
METRIC RANK
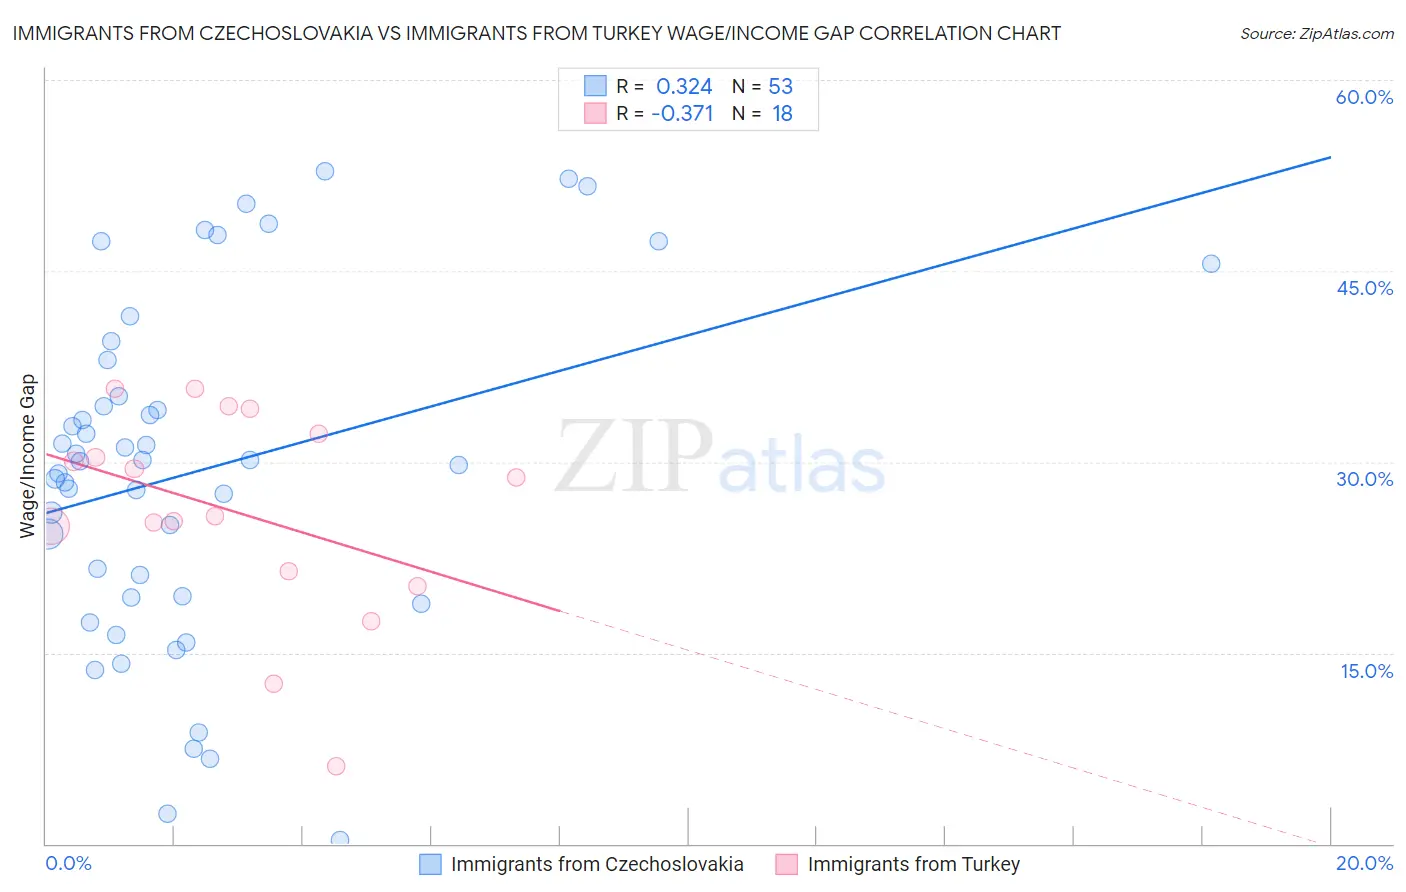
Immigrants from Czechoslovakia vs Immigrants from Turkey Wage/Income Gap Correlation Chart
The statistical analysis conducted on geographies consisting of 195,414,700 people shows a mild positive correlation between the proportion of Immigrants from Czechoslovakia and wage/income gap percentage in the United States with a correlation coefficient (R) of 0.324 and weighted average of 27.3%. Similarly, the statistical analysis conducted on geographies consisting of 223,006,850 people shows a mild negative correlation between the proportion of Immigrants from Turkey and wage/income gap percentage in the United States with a correlation coefficient (R) of -0.371 and weighted average of 27.0%, a difference of 1.2%.
Wage/Income Gap Correlation Summary
| Measurement | Immigrants from Czechoslovakia | Immigrants from Turkey |
| Minimum | 0.26% | 6.1% |
| Maximum | 52.9% | 35.8% |
| Range | 52.6% | 29.7% |
| Mean | 29.3% | 26.1% |
| Median | 30.0% | 27.3% |
| Interquartile 25% (IQ1) | 19.4% | 21.4% |
| Interquartile 75% (IQ3) | 36.6% | 32.2% |
| Interquartile Range (IQR) | 17.2% | 10.8% |
| Standard Deviation (Sample) | 13.3% | 8.1% |
| Standard Deviation (Population) | 13.1% | 7.9% |
Similar Demographics by Wage/Income Gap
Demographics Similar to Immigrants from Czechoslovakia by Wage/Income Gap
In terms of wage/income gap, the demographic groups most similar to Immigrants from Czechoslovakia are Cypriot (27.3%, a difference of 0.020%), Carpatho Rusyn (27.3%, a difference of 0.020%), Celtic (27.3%, a difference of 0.030%), Immigrants from Norway (27.3%, a difference of 0.10%), and Ukrainian (27.3%, a difference of 0.16%).
| Demographics | Rating | Rank | Wage/Income Gap |
| Spanish | 3.6 /100 | #243 | Tragic 27.1% |
| Chickasaw | 3.5 /100 | #244 | Tragic 27.2% |
| Immigrants | Azores | 3.5 /100 | #245 | Tragic 27.2% |
| Immigrants | Nonimmigrants | 3.3 /100 | #246 | Tragic 27.2% |
| Celtics | 2.8 /100 | #247 | Tragic 27.3% |
| Cypriots | 2.8 /100 | #248 | Tragic 27.3% |
| Carpatho Rusyns | 2.7 /100 | #249 | Tragic 27.3% |
| Immigrants | Czechoslovakia | 2.7 /100 | #250 | Tragic 27.3% |
| Immigrants | Norway | 2.5 /100 | #251 | Tragic 27.3% |
| Ukrainians | 2.4 /100 | #252 | Tragic 27.3% |
| Portuguese | 2.2 /100 | #253 | Tragic 27.4% |
| Israelis | 2.1 /100 | #254 | Tragic 27.4% |
| Immigrants | France | 2.1 /100 | #255 | Tragic 27.4% |
| Cherokee | 1.9 /100 | #256 | Tragic 27.4% |
| Luxembourgers | 1.9 /100 | #257 | Tragic 27.4% |
Demographics Similar to Immigrants from Turkey by Wage/Income Gap
In terms of wage/income gap, the demographic groups most similar to Immigrants from Turkey are Spaniard (27.0%, a difference of 0.0%), Immigrants from Asia (27.0%, a difference of 0.030%), Asian (26.9%, a difference of 0.080%), Ottawa (27.0%, a difference of 0.080%), and Bhutanese (27.0%, a difference of 0.11%).
| Demographics | Rating | Rank | Wage/Income Gap |
| Immigrants | Spain | 8.5 /100 | #221 | Tragic 26.8% |
| Bolivians | 8.3 /100 | #222 | Tragic 26.8% |
| Jordanians | 8.0 /100 | #223 | Tragic 26.8% |
| Immigrants | Argentina | 7.2 /100 | #224 | Tragic 26.8% |
| Immigrants | Ireland | 6.5 /100 | #225 | Tragic 26.9% |
| Asians | 5.9 /100 | #226 | Tragic 26.9% |
| Spaniards | 5.6 /100 | #227 | Tragic 27.0% |
| Immigrants | Turkey | 5.6 /100 | #228 | Tragic 27.0% |
| Immigrants | Asia | 5.5 /100 | #229 | Tragic 27.0% |
| Ottawa | 5.3 /100 | #230 | Tragic 27.0% |
| Bhutanese | 5.3 /100 | #231 | Tragic 27.0% |
| Argentineans | 5.2 /100 | #232 | Tragic 27.0% |
| Immigrants | Brazil | 5.0 /100 | #233 | Tragic 27.0% |
| Immigrants | Pakistan | 4.9 /100 | #234 | Tragic 27.0% |
| Immigrants | Hungary | 4.8 /100 | #235 | Tragic 27.0% |