Alsatian vs Immigrants from Thailand In Labor Force | Age 20-64
COMPARE
Alsatian
Immigrants from Thailand
In Labor Force | Age 20-64
In Labor Force | Age 20-64 Comparison
Alsatians
Immigrants from Thailand
79.1%
IN LABOR FORCE | AGE 20-64
5.7/ 100
METRIC RATING
229th/ 347
METRIC RANK
79.4%
IN LABOR FORCE | AGE 20-64
24.8/ 100
METRIC RATING
194th/ 347
METRIC RANK
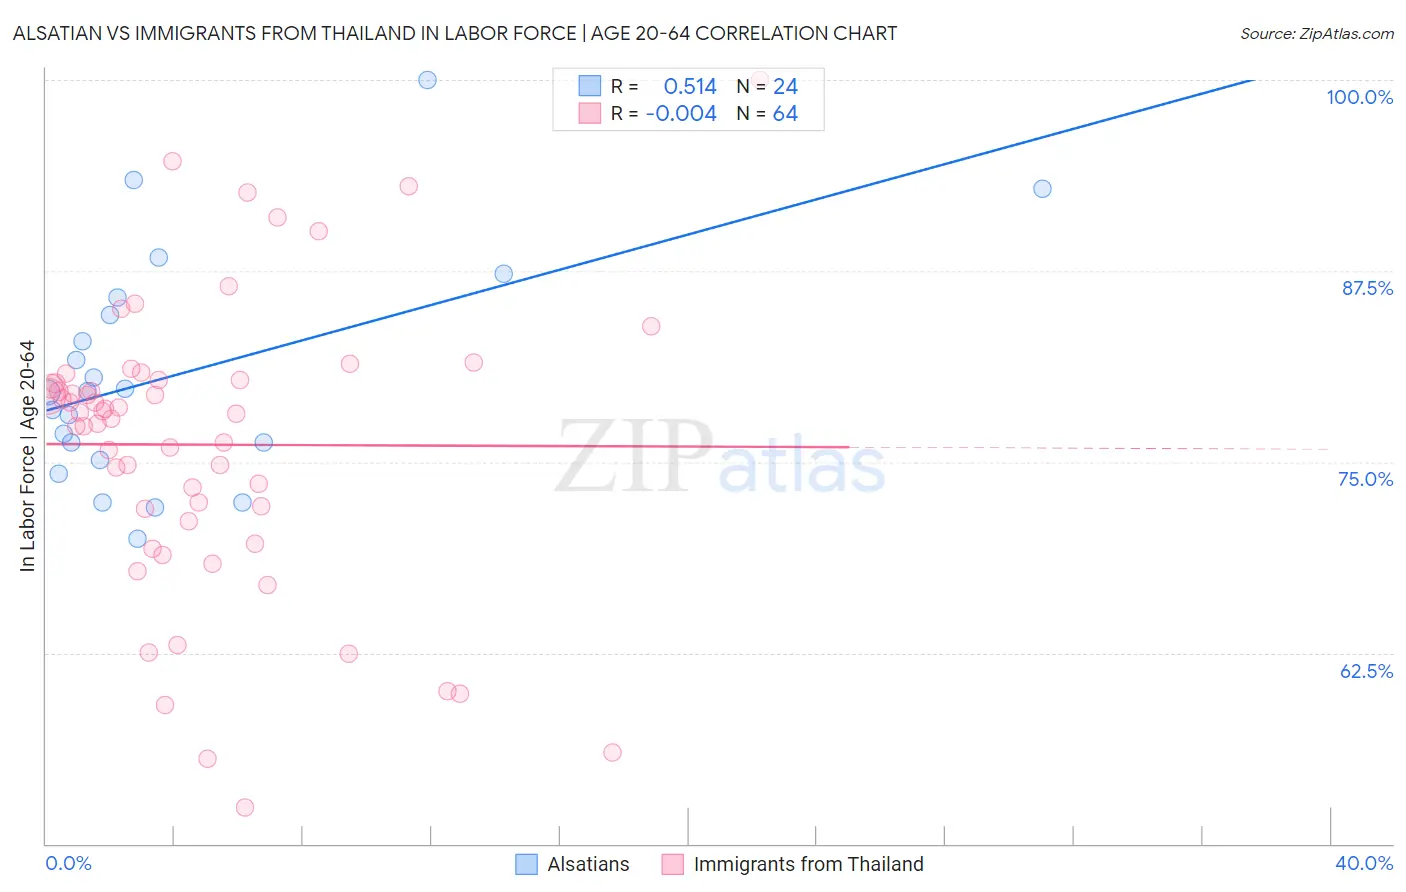
Alsatian vs Immigrants from Thailand In Labor Force | Age 20-64 Correlation Chart
The statistical analysis conducted on geographies consisting of 82,681,658 people shows a substantial positive correlation between the proportion of Alsatians and labor force participation rate among population between the ages 20 and 64 in the United States with a correlation coefficient (R) of 0.514 and weighted average of 79.1%. Similarly, the statistical analysis conducted on geographies consisting of 317,022,892 people shows no correlation between the proportion of Immigrants from Thailand and labor force participation rate among population between the ages 20 and 64 in the United States with a correlation coefficient (R) of -0.004 and weighted average of 79.4%, a difference of 0.34%.
In Labor Force | Age 20-64 Correlation Summary
| Measurement | Alsatian | Immigrants from Thailand |
| Minimum | 70.0% | 52.4% |
| Maximum | 100.0% | 100.0% |
| Range | 30.0% | 47.6% |
| Mean | 80.8% | 76.1% |
| Median | 79.6% | 78.2% |
| Interquartile 25% (IQ1) | 75.7% | 71.5% |
| Interquartile 75% (IQ3) | 85.2% | 80.4% |
| Interquartile Range (IQR) | 9.5% | 8.9% |
| Standard Deviation (Sample) | 7.5% | 9.5% |
| Standard Deviation (Population) | 7.4% | 9.5% |
Similar Demographics by In Labor Force | Age 20-64
Demographics Similar to Alsatians by In Labor Force | Age 20-64
In terms of in labor force | age 20-64, the demographic groups most similar to Alsatians are Panamanian (79.1%, a difference of 0.0%), Native Hawaiian (79.1%, a difference of 0.0%), Central American (79.1%, a difference of 0.010%), Immigrants from Western Europe (79.1%, a difference of 0.010%), and Portuguese (79.1%, a difference of 0.020%).
| Demographics | Rating | Rank | In Labor Force | Age 20-64 |
| Immigrants | Panama | 6.9 /100 | #222 | Tragic 79.1% |
| Canadians | 6.8 /100 | #223 | Tragic 79.1% |
| Immigrants | Uzbekistan | 6.8 /100 | #224 | Tragic 79.1% |
| Portuguese | 6.4 /100 | #225 | Tragic 79.1% |
| Central Americans | 5.9 /100 | #226 | Tragic 79.1% |
| Immigrants | Western Europe | 5.9 /100 | #227 | Tragic 79.1% |
| Panamanians | 5.7 /100 | #228 | Tragic 79.1% |
| Alsatians | 5.7 /100 | #229 | Tragic 79.1% |
| Native Hawaiians | 5.6 /100 | #230 | Tragic 79.1% |
| Lebanese | 5.1 /100 | #231 | Tragic 79.1% |
| Guamanians/Chamorros | 4.5 /100 | #232 | Tragic 79.1% |
| Japanese | 4.0 /100 | #233 | Tragic 79.1% |
| Immigrants | Canada | 3.2 /100 | #234 | Tragic 79.0% |
| Tlingit-Haida | 3.2 /100 | #235 | Tragic 79.0% |
| Samoans | 2.9 /100 | #236 | Tragic 79.0% |
Demographics Similar to Immigrants from Thailand by In Labor Force | Age 20-64
In terms of in labor force | age 20-64, the demographic groups most similar to Immigrants from Thailand are Indonesian (79.4%, a difference of 0.010%), Immigrants from Austria (79.4%, a difference of 0.010%), Immigrants from Denmark (79.4%, a difference of 0.020%), Ecuadorian (79.4%, a difference of 0.020%), and Immigrants from Senegal (79.4%, a difference of 0.020%).
| Demographics | Rating | Rank | In Labor Force | Age 20-64 |
| Assyrians/Chaldeans/Syriacs | 33.3 /100 | #187 | Fair 79.4% |
| Immigrants | Haiti | 32.1 /100 | #188 | Fair 79.4% |
| Immigrants | El Salvador | 30.9 /100 | #189 | Fair 79.4% |
| Immigrants | Syria | 30.8 /100 | #190 | Fair 79.4% |
| Swiss | 28.9 /100 | #191 | Fair 79.4% |
| Immigrants | Denmark | 26.9 /100 | #192 | Fair 79.4% |
| Indonesians | 26.1 /100 | #193 | Fair 79.4% |
| Immigrants | Thailand | 24.8 /100 | #194 | Fair 79.4% |
| Immigrants | Austria | 23.7 /100 | #195 | Fair 79.4% |
| Ecuadorians | 23.1 /100 | #196 | Fair 79.4% |
| Immigrants | Senegal | 22.5 /100 | #197 | Fair 79.4% |
| Immigrants | Laos | 21.5 /100 | #198 | Fair 79.4% |
| Dutch | 20.2 /100 | #199 | Fair 79.3% |
| Immigrants | Oceania | 19.1 /100 | #200 | Poor 79.3% |
| Immigrants | Nicaragua | 19.0 /100 | #201 | Poor 79.3% |