Aleut vs Honduran Median Female Earnings
COMPARE
Aleut
Honduran
Median Female Earnings
Median Female Earnings Comparison
Aleuts
Hondurans
$38,719
MEDIAN FEMALE EARNINGS
11.6/ 100
METRIC RATING
211th/ 347
METRIC RANK
$35,013
MEDIAN FEMALE EARNINGS
0.0/ 100
METRIC RATING
309th/ 347
METRIC RANK
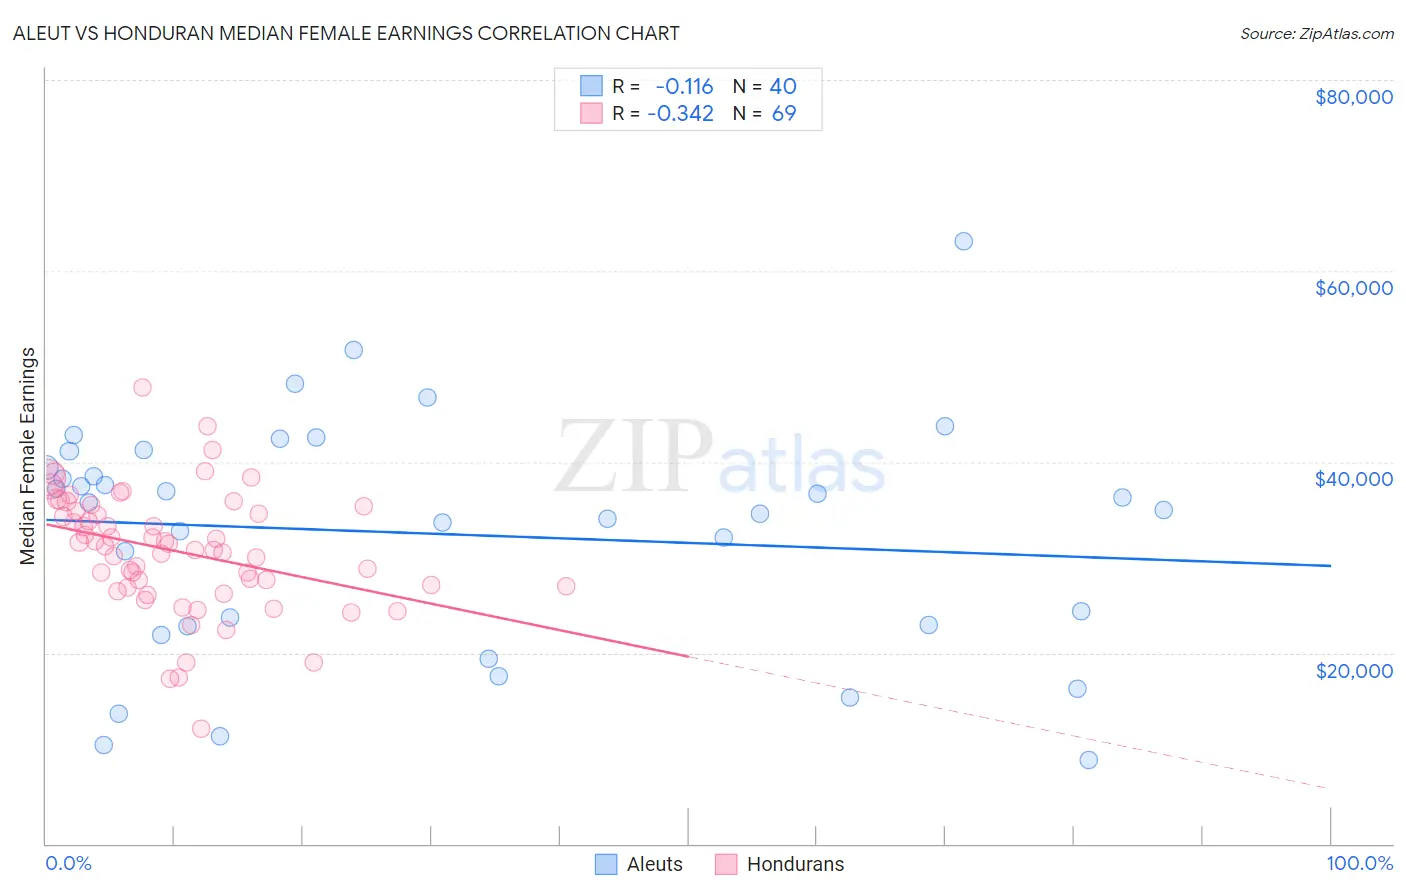
Aleut vs Honduran Median Female Earnings Correlation Chart
The statistical analysis conducted on geographies consisting of 61,761,178 people shows a poor negative correlation between the proportion of Aleuts and median female earnings in the United States with a correlation coefficient (R) of -0.116 and weighted average of $38,719. Similarly, the statistical analysis conducted on geographies consisting of 357,702,253 people shows a mild negative correlation between the proportion of Hondurans and median female earnings in the United States with a correlation coefficient (R) of -0.342 and weighted average of $35,013, a difference of 10.6%.
Median Female Earnings Correlation Summary
| Measurement | Aleut | Honduran |
| Minimum | $8,750 | $12,102 |
| Maximum | $63,125 | $47,798 |
| Range | $54,375 | $35,696 |
| Mean | $32,459 | $30,670 |
| Median | $35,345 | $31,162 |
| Interquartile 25% (IQ1) | $22,835 | $26,901 |
| Interquartile 75% (IQ3) | $40,258 | $35,123 |
| Interquartile Range (IQR) | $17,423 | $8,221 |
| Standard Deviation (Sample) | $12,271 | $6,330 |
| Standard Deviation (Population) | $12,117 | $6,284 |
Similar Demographics by Median Female Earnings
Demographics Similar to Aleuts by Median Female Earnings
In terms of median female earnings, the demographic groups most similar to Aleuts are Guamanian/Chamorro ($38,717, a difference of 0.010%), Czechoslovakian ($38,738, a difference of 0.050%), Jamaican ($38,670, a difference of 0.13%), Iraqi ($38,666, a difference of 0.14%), and Spaniard ($38,656, a difference of 0.16%).
| Demographics | Rating | Rank | Median Female Earnings |
| Immigrants | Uruguay | 17.3 /100 | #204 | Poor $38,945 |
| Immigrants | Colombia | 16.3 /100 | #205 | Poor $38,913 |
| Immigrants | Bosnia and Herzegovina | 15.6 /100 | #206 | Poor $38,886 |
| Immigrants | Cambodia | 14.2 /100 | #207 | Poor $38,833 |
| Immigrants | Thailand | 13.6 /100 | #208 | Poor $38,810 |
| Norwegians | 13.4 /100 | #209 | Poor $38,802 |
| Czechoslovakians | 12.0 /100 | #210 | Poor $38,738 |
| Aleuts | 11.6 /100 | #211 | Poor $38,719 |
| Guamanians/Chamorros | 11.5 /100 | #212 | Poor $38,717 |
| Jamaicans | 10.5 /100 | #213 | Poor $38,670 |
| Iraqis | 10.5 /100 | #214 | Poor $38,666 |
| Spaniards | 10.3 /100 | #215 | Poor $38,656 |
| Immigrants | Ecuador | 10.1 /100 | #216 | Poor $38,644 |
| Immigrants | Jamaica | 9.7 /100 | #217 | Tragic $38,625 |
| Cape Verdeans | 9.5 /100 | #218 | Tragic $38,614 |
Demographics Similar to Hondurans by Median Female Earnings
In terms of median female earnings, the demographic groups most similar to Hondurans are Chippewa ($35,003, a difference of 0.030%), Immigrants from Bahamas ($35,027, a difference of 0.040%), Sioux ($35,063, a difference of 0.14%), Ute ($34,960, a difference of 0.15%), and Yaqui ($34,943, a difference of 0.20%).
| Demographics | Rating | Rank | Median Female Earnings |
| Blacks/African Americans | 0.0 /100 | #302 | Tragic $35,315 |
| Immigrants | Latin America | 0.0 /100 | #303 | Tragic $35,307 |
| Crow | 0.0 /100 | #304 | Tragic $35,266 |
| Bahamians | 0.0 /100 | #305 | Tragic $35,125 |
| Fijians | 0.0 /100 | #306 | Tragic $35,114 |
| Sioux | 0.0 /100 | #307 | Tragic $35,063 |
| Immigrants | Bahamas | 0.0 /100 | #308 | Tragic $35,027 |
| Hondurans | 0.0 /100 | #309 | Tragic $35,013 |
| Chippewa | 0.0 /100 | #310 | Tragic $35,003 |
| Ute | 0.0 /100 | #311 | Tragic $34,960 |
| Yaqui | 0.0 /100 | #312 | Tragic $34,943 |
| Cubans | 0.0 /100 | #313 | Tragic $34,942 |
| Apache | 0.0 /100 | #314 | Tragic $34,895 |
| Pennsylvania Germans | 0.0 /100 | #315 | Tragic $34,802 |
| Cherokee | 0.0 /100 | #316 | Tragic $34,742 |