Aleut vs Paiute Median Female Earnings
COMPARE
Aleut
Paiute
Median Female Earnings
Median Female Earnings Comparison
Aleuts
Paiute
$38,719
MEDIAN FEMALE EARNINGS
11.6/ 100
METRIC RATING
211th/ 347
METRIC RANK
$36,056
MEDIAN FEMALE EARNINGS
0.1/ 100
METRIC RATING
285th/ 347
METRIC RANK
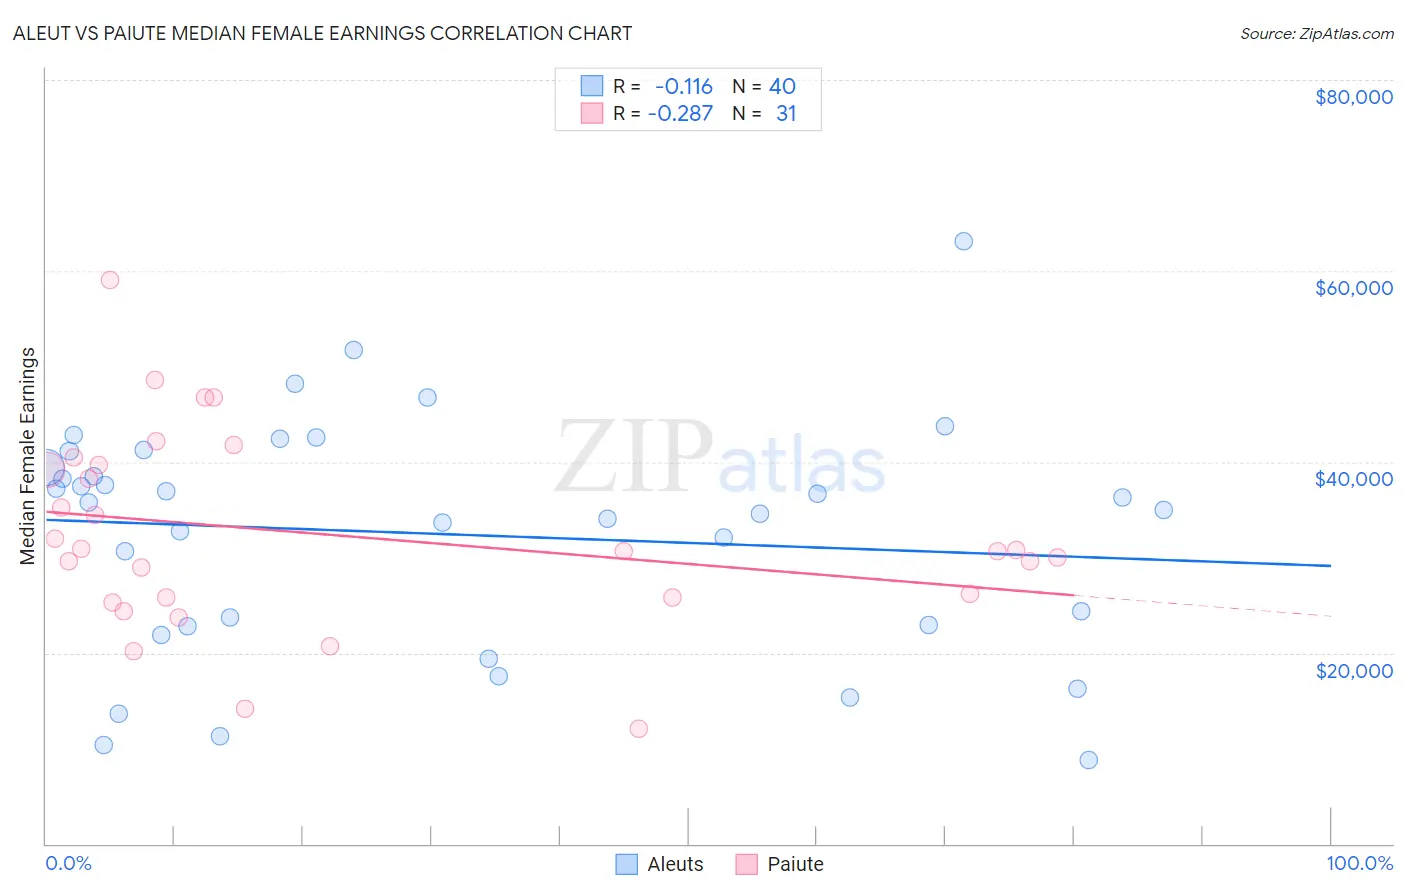
Aleut vs Paiute Median Female Earnings Correlation Chart
The statistical analysis conducted on geographies consisting of 61,761,178 people shows a poor negative correlation between the proportion of Aleuts and median female earnings in the United States with a correlation coefficient (R) of -0.116 and weighted average of $38,719. Similarly, the statistical analysis conducted on geographies consisting of 58,379,978 people shows a weak negative correlation between the proportion of Paiute and median female earnings in the United States with a correlation coefficient (R) of -0.287 and weighted average of $36,056, a difference of 7.4%.
Median Female Earnings Correlation Summary
| Measurement | Aleut | Paiute |
| Minimum | $8,750 | $12,045 |
| Maximum | $63,125 | $59,011 |
| Range | $54,375 | $46,966 |
| Mean | $32,459 | $32,370 |
| Median | $35,345 | $30,682 |
| Interquartile 25% (IQ1) | $22,835 | $25,816 |
| Interquartile 75% (IQ3) | $40,258 | $39,733 |
| Interquartile Range (IQR) | $17,423 | $13,917 |
| Standard Deviation (Sample) | $12,271 | $10,286 |
| Standard Deviation (Population) | $12,117 | $10,119 |
Similar Demographics by Median Female Earnings
Demographics Similar to Aleuts by Median Female Earnings
In terms of median female earnings, the demographic groups most similar to Aleuts are Guamanian/Chamorro ($38,717, a difference of 0.010%), Czechoslovakian ($38,738, a difference of 0.050%), Jamaican ($38,670, a difference of 0.13%), Iraqi ($38,666, a difference of 0.14%), and Spaniard ($38,656, a difference of 0.16%).
| Demographics | Rating | Rank | Median Female Earnings |
| Immigrants | Uruguay | 17.3 /100 | #204 | Poor $38,945 |
| Immigrants | Colombia | 16.3 /100 | #205 | Poor $38,913 |
| Immigrants | Bosnia and Herzegovina | 15.6 /100 | #206 | Poor $38,886 |
| Immigrants | Cambodia | 14.2 /100 | #207 | Poor $38,833 |
| Immigrants | Thailand | 13.6 /100 | #208 | Poor $38,810 |
| Norwegians | 13.4 /100 | #209 | Poor $38,802 |
| Czechoslovakians | 12.0 /100 | #210 | Poor $38,738 |
| Aleuts | 11.6 /100 | #211 | Poor $38,719 |
| Guamanians/Chamorros | 11.5 /100 | #212 | Poor $38,717 |
| Jamaicans | 10.5 /100 | #213 | Poor $38,670 |
| Iraqis | 10.5 /100 | #214 | Poor $38,666 |
| Spaniards | 10.3 /100 | #215 | Poor $38,656 |
| Immigrants | Ecuador | 10.1 /100 | #216 | Poor $38,644 |
| Immigrants | Jamaica | 9.7 /100 | #217 | Tragic $38,625 |
| Cape Verdeans | 9.5 /100 | #218 | Tragic $38,614 |
Demographics Similar to Paiute by Median Female Earnings
In terms of median female earnings, the demographic groups most similar to Paiute are Osage ($36,034, a difference of 0.060%), Immigrants from Nicaragua ($36,023, a difference of 0.090%), Immigrants from Zaire ($36,017, a difference of 0.11%), Indonesian ($36,140, a difference of 0.23%), and Bangladeshi ($35,960, a difference of 0.27%).
| Demographics | Rating | Rank | Median Female Earnings |
| U.S. Virgin Islanders | 0.1 /100 | #278 | Tragic $36,424 |
| Immigrants | Caribbean | 0.1 /100 | #279 | Tragic $36,414 |
| Iroquois | 0.1 /100 | #280 | Tragic $36,408 |
| Spanish Americans | 0.1 /100 | #281 | Tragic $36,391 |
| Haitians | 0.1 /100 | #282 | Tragic $36,374 |
| Immigrants | Haiti | 0.1 /100 | #283 | Tragic $36,203 |
| Indonesians | 0.1 /100 | #284 | Tragic $36,140 |
| Paiute | 0.1 /100 | #285 | Tragic $36,056 |
| Osage | 0.0 /100 | #286 | Tragic $36,034 |
| Immigrants | Nicaragua | 0.0 /100 | #287 | Tragic $36,023 |
| Immigrants | Zaire | 0.0 /100 | #288 | Tragic $36,017 |
| Bangladeshis | 0.0 /100 | #289 | Tragic $35,960 |
| Central American Indians | 0.0 /100 | #290 | Tragic $35,930 |
| Blackfeet | 0.0 /100 | #291 | Tragic $35,864 |
| Americans | 0.0 /100 | #292 | Tragic $35,777 |