Aleut vs Immigrants from South America Median Female Earnings
COMPARE
Aleut
Immigrants from South America
Median Female Earnings
Median Female Earnings Comparison
Aleuts
Immigrants from South America
$38,719
MEDIAN FEMALE EARNINGS
11.6/ 100
METRIC RATING
211th/ 347
METRIC RANK
$39,643
MEDIAN FEMALE EARNINGS
47.2/ 100
METRIC RATING
175th/ 347
METRIC RANK
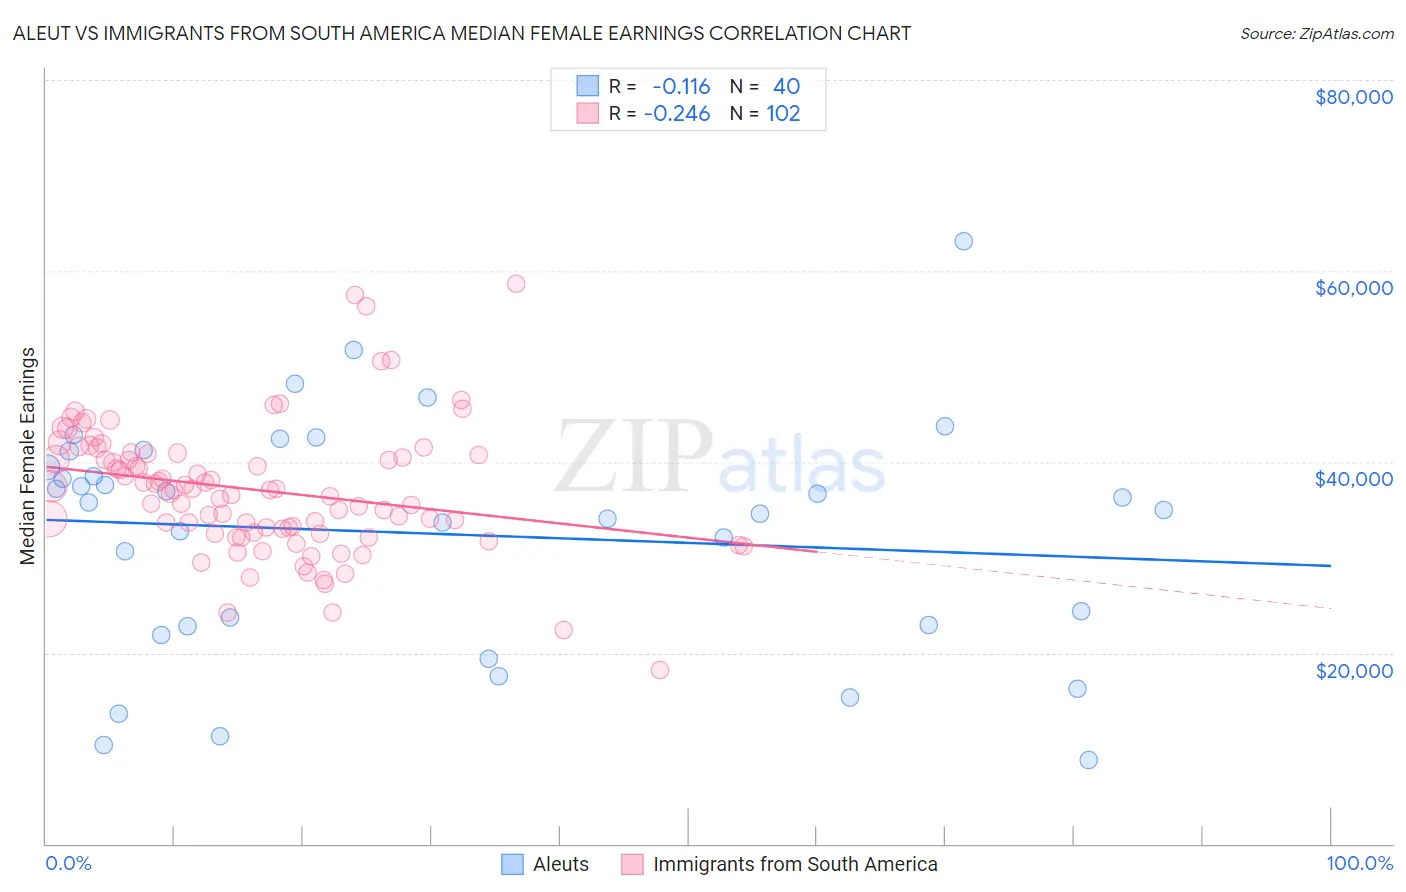
Aleut vs Immigrants from South America Median Female Earnings Correlation Chart
The statistical analysis conducted on geographies consisting of 61,761,178 people shows a poor negative correlation between the proportion of Aleuts and median female earnings in the United States with a correlation coefficient (R) of -0.116 and weighted average of $38,719. Similarly, the statistical analysis conducted on geographies consisting of 486,047,092 people shows a weak negative correlation between the proportion of Immigrants from South America and median female earnings in the United States with a correlation coefficient (R) of -0.246 and weighted average of $39,643, a difference of 2.4%.
Median Female Earnings Correlation Summary
| Measurement | Aleut | Immigrants from South America |
| Minimum | $8,750 | $18,150 |
| Maximum | $63,125 | $58,709 |
| Range | $54,375 | $40,559 |
| Mean | $32,459 | $37,049 |
| Median | $35,345 | $37,037 |
| Interquartile 25% (IQ1) | $22,835 | $32,572 |
| Interquartile 75% (IQ3) | $40,258 | $40,849 |
| Interquartile Range (IQR) | $17,423 | $8,277 |
| Standard Deviation (Sample) | $12,271 | $6,851 |
| Standard Deviation (Population) | $12,117 | $6,817 |
Similar Demographics by Median Female Earnings
Demographics Similar to Aleuts by Median Female Earnings
In terms of median female earnings, the demographic groups most similar to Aleuts are Guamanian/Chamorro ($38,717, a difference of 0.010%), Czechoslovakian ($38,738, a difference of 0.050%), Jamaican ($38,670, a difference of 0.13%), Iraqi ($38,666, a difference of 0.14%), and Spaniard ($38,656, a difference of 0.16%).
| Demographics | Rating | Rank | Median Female Earnings |
| Immigrants | Uruguay | 17.3 /100 | #204 | Poor $38,945 |
| Immigrants | Colombia | 16.3 /100 | #205 | Poor $38,913 |
| Immigrants | Bosnia and Herzegovina | 15.6 /100 | #206 | Poor $38,886 |
| Immigrants | Cambodia | 14.2 /100 | #207 | Poor $38,833 |
| Immigrants | Thailand | 13.6 /100 | #208 | Poor $38,810 |
| Norwegians | 13.4 /100 | #209 | Poor $38,802 |
| Czechoslovakians | 12.0 /100 | #210 | Poor $38,738 |
| Aleuts | 11.6 /100 | #211 | Poor $38,719 |
| Guamanians/Chamorros | 11.5 /100 | #212 | Poor $38,717 |
| Jamaicans | 10.5 /100 | #213 | Poor $38,670 |
| Iraqis | 10.5 /100 | #214 | Poor $38,666 |
| Spaniards | 10.3 /100 | #215 | Poor $38,656 |
| Immigrants | Ecuador | 10.1 /100 | #216 | Poor $38,644 |
| Immigrants | Jamaica | 9.7 /100 | #217 | Tragic $38,625 |
| Cape Verdeans | 9.5 /100 | #218 | Tragic $38,614 |
Demographics Similar to Immigrants from South America by Median Female Earnings
In terms of median female earnings, the demographic groups most similar to Immigrants from South America are Nigerian ($39,641, a difference of 0.010%), Costa Rican ($39,622, a difference of 0.050%), Slavic ($39,613, a difference of 0.080%), Immigrants from Germany ($39,603, a difference of 0.10%), and South American ($39,698, a difference of 0.14%).
| Demographics | Rating | Rank | Median Female Earnings |
| Immigrants | Peru | 58.9 /100 | #168 | Average $39,871 |
| Kenyans | 58.4 /100 | #169 | Average $39,860 |
| Slovenes | 56.2 /100 | #170 | Average $39,817 |
| Immigrants | Portugal | 54.7 /100 | #171 | Average $39,788 |
| British | 53.8 /100 | #172 | Average $39,772 |
| Canadians | 51.4 /100 | #173 | Average $39,724 |
| South Americans | 50.0 /100 | #174 | Average $39,698 |
| Immigrants | South America | 47.2 /100 | #175 | Average $39,643 |
| Nigerians | 47.0 /100 | #176 | Average $39,641 |
| Costa Ricans | 46.1 /100 | #177 | Average $39,622 |
| Slavs | 45.6 /100 | #178 | Average $39,613 |
| Immigrants | Germany | 45.1 /100 | #179 | Average $39,603 |
| Immigrants | Kenya | 41.6 /100 | #180 | Average $39,535 |
| Tsimshian | 41.4 /100 | #181 | Average $39,530 |
| Tlingit-Haida | 40.5 /100 | #182 | Average $39,513 |