Aleut vs Pakistani Median Female Earnings
COMPARE
Aleut
Pakistani
Median Female Earnings
Median Female Earnings Comparison
Aleuts
Pakistanis
$38,719
MEDIAN FEMALE EARNINGS
11.6/ 100
METRIC RATING
211th/ 347
METRIC RANK
$40,596
MEDIAN FEMALE EARNINGS
86.6/ 100
METRIC RATING
137th/ 347
METRIC RANK
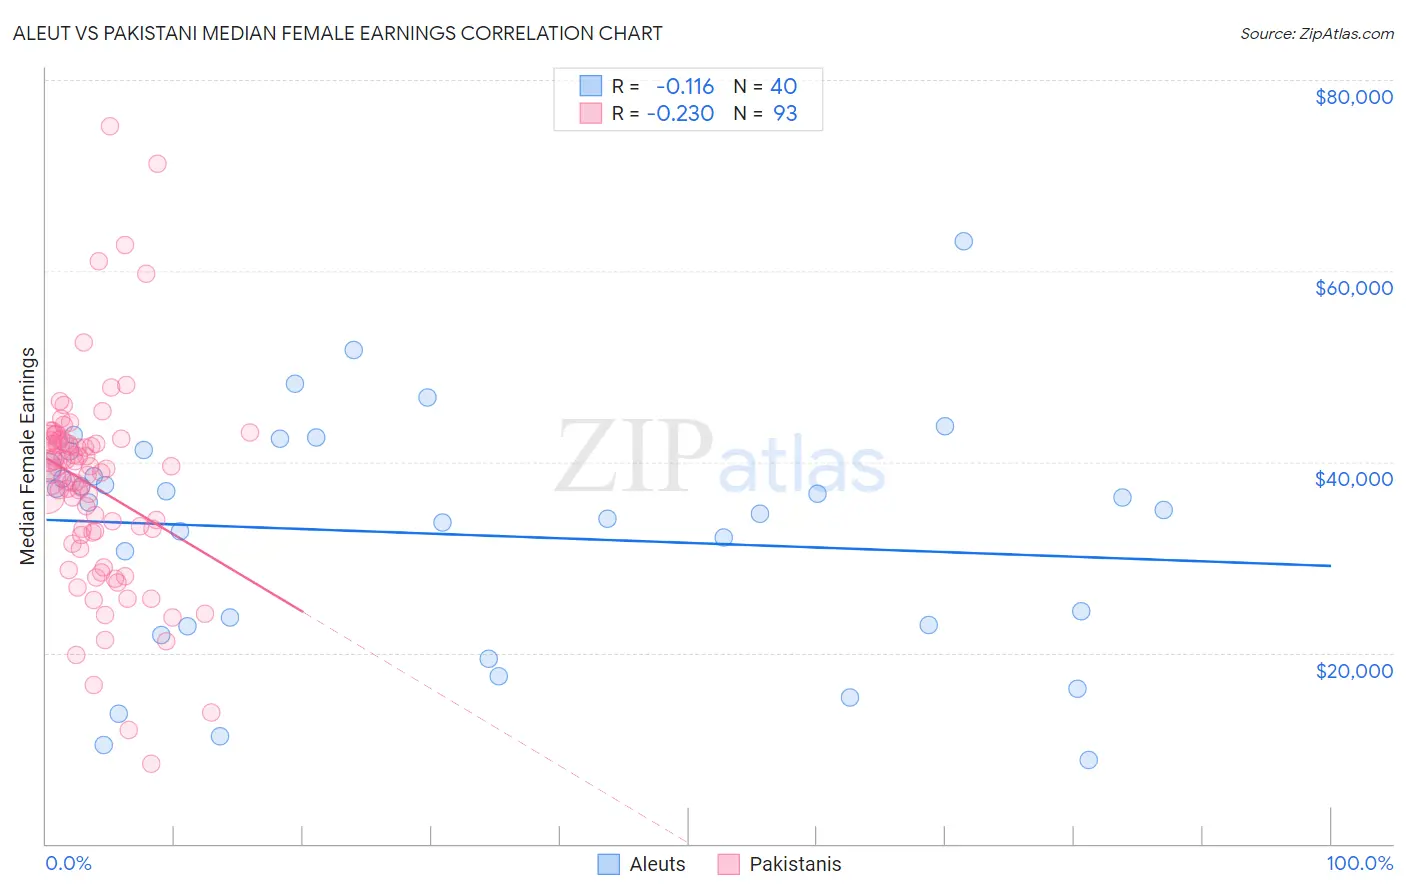
Aleut vs Pakistani Median Female Earnings Correlation Chart
The statistical analysis conducted on geographies consisting of 61,761,178 people shows a poor negative correlation between the proportion of Aleuts and median female earnings in the United States with a correlation coefficient (R) of -0.116 and weighted average of $38,719. Similarly, the statistical analysis conducted on geographies consisting of 335,277,808 people shows a weak negative correlation between the proportion of Pakistanis and median female earnings in the United States with a correlation coefficient (R) of -0.230 and weighted average of $40,596, a difference of 4.9%.
Median Female Earnings Correlation Summary
| Measurement | Aleut | Pakistani |
| Minimum | $8,750 | $8,380 |
| Maximum | $63,125 | $75,132 |
| Range | $54,375 | $66,752 |
| Mean | $32,459 | $37,425 |
| Median | $35,345 | $38,904 |
| Interquartile 25% (IQ1) | $22,835 | $31,921 |
| Interquartile 75% (IQ3) | $40,258 | $42,191 |
| Interquartile Range (IQR) | $17,423 | $10,270 |
| Standard Deviation (Sample) | $12,271 | $10,860 |
| Standard Deviation (Population) | $12,117 | $10,802 |
Similar Demographics by Median Female Earnings
Demographics Similar to Aleuts by Median Female Earnings
In terms of median female earnings, the demographic groups most similar to Aleuts are Guamanian/Chamorro ($38,717, a difference of 0.010%), Czechoslovakian ($38,738, a difference of 0.050%), Jamaican ($38,670, a difference of 0.13%), Iraqi ($38,666, a difference of 0.14%), and Spaniard ($38,656, a difference of 0.16%).
| Demographics | Rating | Rank | Median Female Earnings |
| Immigrants | Uruguay | 17.3 /100 | #204 | Poor $38,945 |
| Immigrants | Colombia | 16.3 /100 | #205 | Poor $38,913 |
| Immigrants | Bosnia and Herzegovina | 15.6 /100 | #206 | Poor $38,886 |
| Immigrants | Cambodia | 14.2 /100 | #207 | Poor $38,833 |
| Immigrants | Thailand | 13.6 /100 | #208 | Poor $38,810 |
| Norwegians | 13.4 /100 | #209 | Poor $38,802 |
| Czechoslovakians | 12.0 /100 | #210 | Poor $38,738 |
| Aleuts | 11.6 /100 | #211 | Poor $38,719 |
| Guamanians/Chamorros | 11.5 /100 | #212 | Poor $38,717 |
| Jamaicans | 10.5 /100 | #213 | Poor $38,670 |
| Iraqis | 10.5 /100 | #214 | Poor $38,666 |
| Spaniards | 10.3 /100 | #215 | Poor $38,656 |
| Immigrants | Ecuador | 10.1 /100 | #216 | Poor $38,644 |
| Immigrants | Jamaica | 9.7 /100 | #217 | Tragic $38,625 |
| Cape Verdeans | 9.5 /100 | #218 | Tragic $38,614 |
Demographics Similar to Pakistanis by Median Female Earnings
In terms of median female earnings, the demographic groups most similar to Pakistanis are Taiwanese ($40,576, a difference of 0.050%), Immigrants from South Eastern Asia ($40,558, a difference of 0.090%), Immigrants from Eastern Africa ($40,644, a difference of 0.12%), Serbian ($40,539, a difference of 0.14%), and Immigrants from Syria ($40,499, a difference of 0.24%).
| Demographics | Rating | Rank | Median Female Earnings |
| Immigrants | Guyana | 90.3 /100 | #130 | Exceptional $40,773 |
| Chileans | 90.0 /100 | #131 | Exceptional $40,757 |
| Immigrants | Uganda | 89.7 /100 | #132 | Excellent $40,739 |
| Syrians | 89.5 /100 | #133 | Excellent $40,727 |
| Arabs | 89.3 /100 | #134 | Excellent $40,718 |
| Immigrants | Nepal | 89.0 /100 | #135 | Excellent $40,704 |
| Immigrants | Eastern Africa | 87.7 /100 | #136 | Excellent $40,644 |
| Pakistanis | 86.6 /100 | #137 | Excellent $40,596 |
| Taiwanese | 86.1 /100 | #138 | Excellent $40,576 |
| Immigrants | South Eastern Asia | 85.7 /100 | #139 | Excellent $40,558 |
| Serbians | 85.2 /100 | #140 | Excellent $40,539 |
| Immigrants | Syria | 84.1 /100 | #141 | Excellent $40,499 |
| Sri Lankans | 84.0 /100 | #142 | Excellent $40,496 |
| Northern Europeans | 83.9 /100 | #143 | Excellent $40,491 |
| Immigrants | North Macedonia | 83.8 /100 | #144 | Excellent $40,488 |