Central American Indian vs Paiute Median Female Earnings
COMPARE
Central American Indian
Paiute
Median Female Earnings
Median Female Earnings Comparison
Central American Indians
Paiute
$35,930
MEDIAN FEMALE EARNINGS
0.0/ 100
METRIC RATING
290th/ 347
METRIC RANK
$36,056
MEDIAN FEMALE EARNINGS
0.1/ 100
METRIC RATING
285th/ 347
METRIC RANK
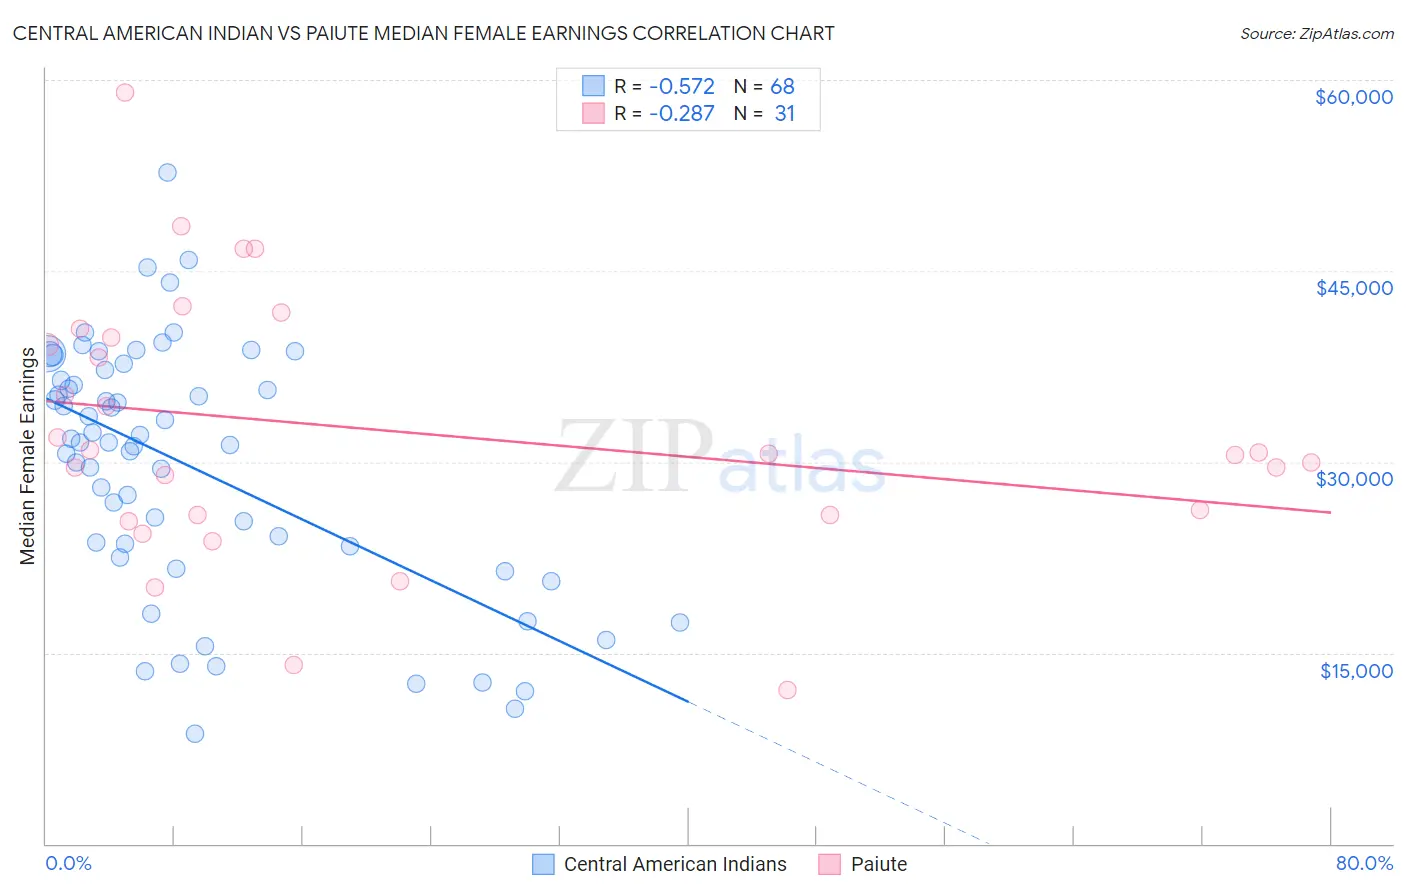
Central American Indian vs Paiute Median Female Earnings Correlation Chart
The statistical analysis conducted on geographies consisting of 326,049,316 people shows a substantial negative correlation between the proportion of Central American Indians and median female earnings in the United States with a correlation coefficient (R) of -0.572 and weighted average of $35,930. Similarly, the statistical analysis conducted on geographies consisting of 58,379,978 people shows a weak negative correlation between the proportion of Paiute and median female earnings in the United States with a correlation coefficient (R) of -0.287 and weighted average of $36,056, a difference of 0.35%.
Median Female Earnings Correlation Summary
| Measurement | Central American Indian | Paiute |
| Minimum | $8,640 | $12,045 |
| Maximum | $52,708 | $59,011 |
| Range | $44,068 | $46,966 |
| Mean | $29,634 | $32,370 |
| Median | $31,554 | $30,682 |
| Interquartile 25% (IQ1) | $22,964 | $25,816 |
| Interquartile 75% (IQ3) | $36,801 | $39,733 |
| Interquartile Range (IQR) | $13,837 | $13,917 |
| Standard Deviation (Sample) | $9,825 | $10,286 |
| Standard Deviation (Population) | $9,752 | $10,119 |
Demographics Similar to Central American Indians and Paiute by Median Female Earnings
In terms of median female earnings, the demographic groups most similar to Central American Indians are Bangladeshi ($35,960, a difference of 0.080%), Blackfeet ($35,864, a difference of 0.18%), Immigrants from Zaire ($36,017, a difference of 0.24%), Immigrants from Nicaragua ($36,023, a difference of 0.26%), and Osage ($36,034, a difference of 0.29%). Similarly, the demographic groups most similar to Paiute are Osage ($36,034, a difference of 0.060%), Immigrants from Nicaragua ($36,023, a difference of 0.090%), Immigrants from Zaire ($36,017, a difference of 0.11%), Indonesian ($36,140, a difference of 0.23%), and Bangladeshi ($35,960, a difference of 0.27%).
| Demographics | Rating | Rank | Median Female Earnings |
| Marshallese | 0.1 /100 | #277 | Tragic $36,459 |
| U.S. Virgin Islanders | 0.1 /100 | #278 | Tragic $36,424 |
| Immigrants | Caribbean | 0.1 /100 | #279 | Tragic $36,414 |
| Iroquois | 0.1 /100 | #280 | Tragic $36,408 |
| Spanish Americans | 0.1 /100 | #281 | Tragic $36,391 |
| Haitians | 0.1 /100 | #282 | Tragic $36,374 |
| Immigrants | Haiti | 0.1 /100 | #283 | Tragic $36,203 |
| Indonesians | 0.1 /100 | #284 | Tragic $36,140 |
| Paiute | 0.1 /100 | #285 | Tragic $36,056 |
| Osage | 0.0 /100 | #286 | Tragic $36,034 |
| Immigrants | Nicaragua | 0.0 /100 | #287 | Tragic $36,023 |
| Immigrants | Zaire | 0.0 /100 | #288 | Tragic $36,017 |
| Bangladeshis | 0.0 /100 | #289 | Tragic $35,960 |
| Central American Indians | 0.0 /100 | #290 | Tragic $35,930 |
| Blackfeet | 0.0 /100 | #291 | Tragic $35,864 |
| Americans | 0.0 /100 | #292 | Tragic $35,777 |
| Guatemalans | 0.0 /100 | #293 | Tragic $35,695 |
| Cheyenne | 0.0 /100 | #294 | Tragic $35,673 |
| Comanche | 0.0 /100 | #295 | Tragic $35,661 |
| Mexican American Indians | 0.0 /100 | #296 | Tragic $35,629 |
| Hmong | 0.0 /100 | #297 | Tragic $35,498 |