Costa Rican vs Paiute Median Female Earnings
COMPARE
Costa Rican
Paiute
Median Female Earnings
Median Female Earnings Comparison
Costa Ricans
Paiute
$39,622
MEDIAN FEMALE EARNINGS
46.1/ 100
METRIC RATING
177th/ 347
METRIC RANK
$36,056
MEDIAN FEMALE EARNINGS
0.1/ 100
METRIC RATING
285th/ 347
METRIC RANK
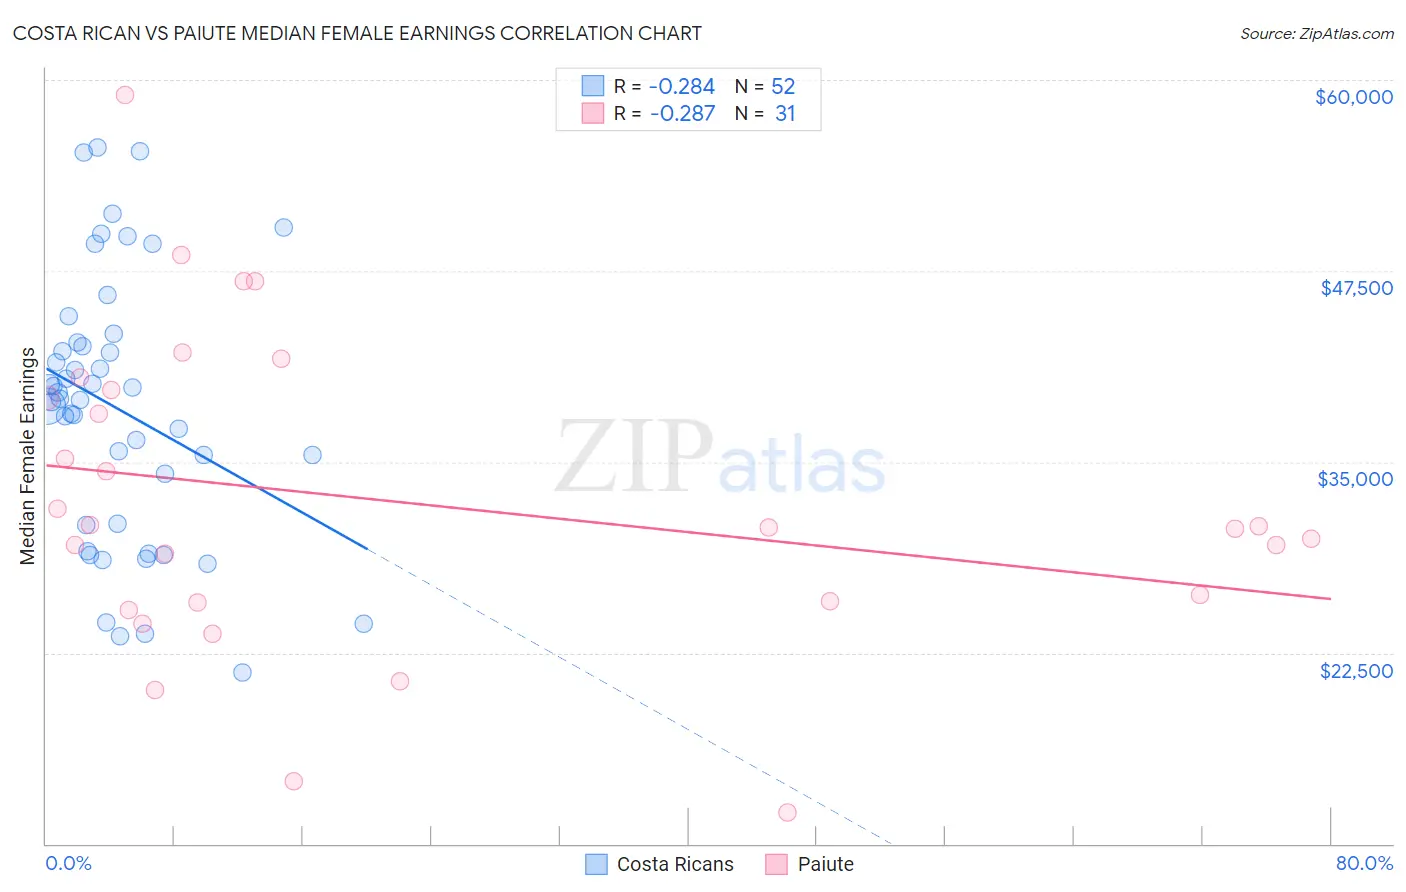
Costa Rican vs Paiute Median Female Earnings Correlation Chart
The statistical analysis conducted on geographies consisting of 253,570,607 people shows a weak negative correlation between the proportion of Costa Ricans and median female earnings in the United States with a correlation coefficient (R) of -0.284 and weighted average of $39,622. Similarly, the statistical analysis conducted on geographies consisting of 58,379,978 people shows a weak negative correlation between the proportion of Paiute and median female earnings in the United States with a correlation coefficient (R) of -0.287 and weighted average of $36,056, a difference of 9.9%.
Median Female Earnings Correlation Summary
| Measurement | Costa Rican | Paiute |
| Minimum | $21,250 | $12,045 |
| Maximum | $55,551 | $59,011 |
| Range | $34,301 | $46,966 |
| Mean | $38,430 | $32,370 |
| Median | $39,100 | $30,682 |
| Interquartile 25% (IQ1) | $30,898 | $25,816 |
| Interquartile 75% (IQ3) | $42,674 | $39,733 |
| Interquartile Range (IQR) | $11,776 | $13,917 |
| Standard Deviation (Sample) | $8,659 | $10,286 |
| Standard Deviation (Population) | $8,575 | $10,119 |
Similar Demographics by Median Female Earnings
Demographics Similar to Costa Ricans by Median Female Earnings
In terms of median female earnings, the demographic groups most similar to Costa Ricans are Slavic ($39,613, a difference of 0.020%), Immigrants from South America ($39,643, a difference of 0.050%), Nigerian ($39,641, a difference of 0.050%), Immigrants from Germany ($39,603, a difference of 0.050%), and South American ($39,698, a difference of 0.19%).
| Demographics | Rating | Rank | Median Female Earnings |
| Slovenes | 56.2 /100 | #170 | Average $39,817 |
| Immigrants | Portugal | 54.7 /100 | #171 | Average $39,788 |
| British | 53.8 /100 | #172 | Average $39,772 |
| Canadians | 51.4 /100 | #173 | Average $39,724 |
| South Americans | 50.0 /100 | #174 | Average $39,698 |
| Immigrants | South America | 47.2 /100 | #175 | Average $39,643 |
| Nigerians | 47.0 /100 | #176 | Average $39,641 |
| Costa Ricans | 46.1 /100 | #177 | Average $39,622 |
| Slavs | 45.6 /100 | #178 | Average $39,613 |
| Immigrants | Germany | 45.1 /100 | #179 | Average $39,603 |
| Immigrants | Kenya | 41.6 /100 | #180 | Average $39,535 |
| Tsimshian | 41.4 /100 | #181 | Average $39,530 |
| Tlingit-Haida | 40.5 /100 | #182 | Average $39,513 |
| Hungarians | 40.3 /100 | #183 | Average $39,510 |
| Europeans | 37.7 /100 | #184 | Fair $39,457 |
Demographics Similar to Paiute by Median Female Earnings
In terms of median female earnings, the demographic groups most similar to Paiute are Osage ($36,034, a difference of 0.060%), Immigrants from Nicaragua ($36,023, a difference of 0.090%), Immigrants from Zaire ($36,017, a difference of 0.11%), Indonesian ($36,140, a difference of 0.23%), and Bangladeshi ($35,960, a difference of 0.27%).
| Demographics | Rating | Rank | Median Female Earnings |
| U.S. Virgin Islanders | 0.1 /100 | #278 | Tragic $36,424 |
| Immigrants | Caribbean | 0.1 /100 | #279 | Tragic $36,414 |
| Iroquois | 0.1 /100 | #280 | Tragic $36,408 |
| Spanish Americans | 0.1 /100 | #281 | Tragic $36,391 |
| Haitians | 0.1 /100 | #282 | Tragic $36,374 |
| Immigrants | Haiti | 0.1 /100 | #283 | Tragic $36,203 |
| Indonesians | 0.1 /100 | #284 | Tragic $36,140 |
| Paiute | 0.1 /100 | #285 | Tragic $36,056 |
| Osage | 0.0 /100 | #286 | Tragic $36,034 |
| Immigrants | Nicaragua | 0.0 /100 | #287 | Tragic $36,023 |
| Immigrants | Zaire | 0.0 /100 | #288 | Tragic $36,017 |
| Bangladeshis | 0.0 /100 | #289 | Tragic $35,960 |
| Central American Indians | 0.0 /100 | #290 | Tragic $35,930 |
| Blackfeet | 0.0 /100 | #291 | Tragic $35,864 |
| Americans | 0.0 /100 | #292 | Tragic $35,777 |