Immigrants from Dominica vs Immigrants from South America Median Female Earnings
COMPARE
Immigrants from Dominica
Immigrants from South America
Median Female Earnings
Median Female Earnings Comparison
Immigrants from Dominica
Immigrants from South America
$37,825
MEDIAN FEMALE EARNINGS
2.0/ 100
METRIC RATING
252nd/ 347
METRIC RANK
$39,643
MEDIAN FEMALE EARNINGS
47.2/ 100
METRIC RATING
175th/ 347
METRIC RANK
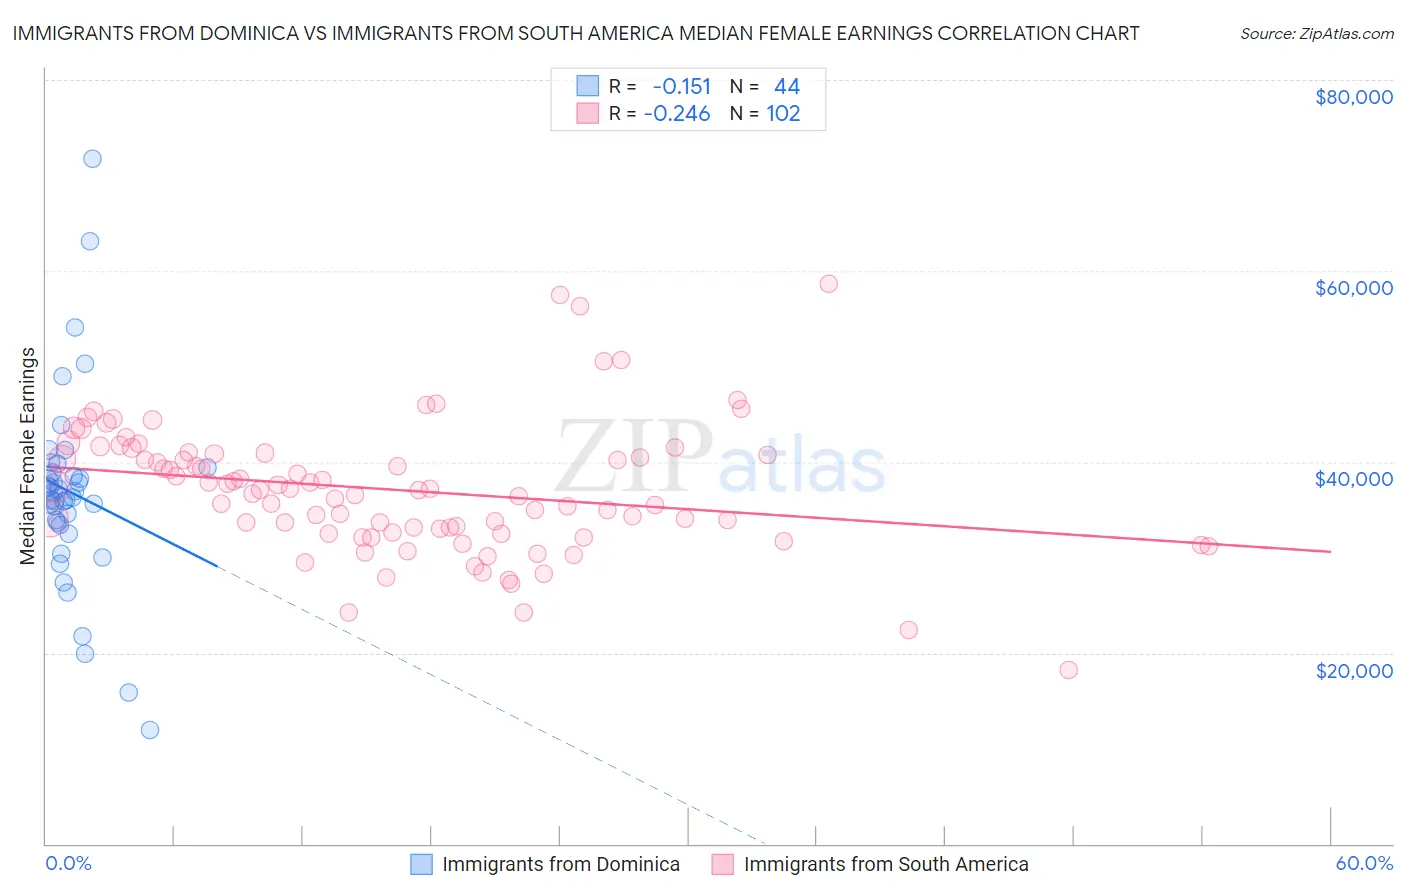
Immigrants from Dominica vs Immigrants from South America Median Female Earnings Correlation Chart
The statistical analysis conducted on geographies consisting of 83,795,110 people shows a poor negative correlation between the proportion of Immigrants from Dominica and median female earnings in the United States with a correlation coefficient (R) of -0.151 and weighted average of $37,825. Similarly, the statistical analysis conducted on geographies consisting of 486,047,092 people shows a weak negative correlation between the proportion of Immigrants from South America and median female earnings in the United States with a correlation coefficient (R) of -0.246 and weighted average of $39,643, a difference of 4.8%.
Median Female Earnings Correlation Summary
| Measurement | Immigrants from Dominica | Immigrants from South America |
| Minimum | $11,953 | $18,150 |
| Maximum | $71,750 | $58,709 |
| Range | $59,797 | $40,559 |
| Mean | $36,730 | $37,049 |
| Median | $36,530 | $37,037 |
| Interquartile 25% (IQ1) | $33,522 | $32,572 |
| Interquartile 75% (IQ3) | $39,104 | $40,849 |
| Interquartile Range (IQR) | $5,583 | $8,277 |
| Standard Deviation (Sample) | $10,397 | $6,851 |
| Standard Deviation (Population) | $10,278 | $6,817 |
Similar Demographics by Median Female Earnings
Demographics Similar to Immigrants from Dominica by Median Female Earnings
In terms of median female earnings, the demographic groups most similar to Immigrants from Dominica are Welsh ($37,856, a difference of 0.080%), Immigrants from Iraq ($37,864, a difference of 0.10%), Alaskan Athabascan ($37,905, a difference of 0.21%), Swiss ($37,904, a difference of 0.21%), and Immigrants from Somalia ($37,914, a difference of 0.23%).
| Demographics | Rating | Rank | Median Female Earnings |
| Immigrants | Middle Africa | 2.7 /100 | #245 | Tragic $37,965 |
| Delaware | 2.6 /100 | #246 | Tragic $37,964 |
| Immigrants | Somalia | 2.4 /100 | #247 | Tragic $37,914 |
| Alaskan Athabascans | 2.3 /100 | #248 | Tragic $37,905 |
| Swiss | 2.3 /100 | #249 | Tragic $37,904 |
| Immigrants | Iraq | 2.2 /100 | #250 | Tragic $37,864 |
| Welsh | 2.1 /100 | #251 | Tragic $37,856 |
| Immigrants | Dominica | 2.0 /100 | #252 | Tragic $37,825 |
| Danes | 1.6 /100 | #253 | Tragic $37,730 |
| Whites/Caucasians | 1.1 /100 | #254 | Tragic $37,531 |
| Colville | 1.1 /100 | #255 | Tragic $37,514 |
| Samoans | 1.0 /100 | #256 | Tragic $37,498 |
| Hawaiians | 1.0 /100 | #257 | Tragic $37,497 |
| Belizeans | 0.9 /100 | #258 | Tragic $37,429 |
| Scotch-Irish | 0.8 /100 | #259 | Tragic $37,383 |
Demographics Similar to Immigrants from South America by Median Female Earnings
In terms of median female earnings, the demographic groups most similar to Immigrants from South America are Nigerian ($39,641, a difference of 0.010%), Costa Rican ($39,622, a difference of 0.050%), Slavic ($39,613, a difference of 0.080%), Immigrants from Germany ($39,603, a difference of 0.10%), and South American ($39,698, a difference of 0.14%).
| Demographics | Rating | Rank | Median Female Earnings |
| Immigrants | Peru | 58.9 /100 | #168 | Average $39,871 |
| Kenyans | 58.4 /100 | #169 | Average $39,860 |
| Slovenes | 56.2 /100 | #170 | Average $39,817 |
| Immigrants | Portugal | 54.7 /100 | #171 | Average $39,788 |
| British | 53.8 /100 | #172 | Average $39,772 |
| Canadians | 51.4 /100 | #173 | Average $39,724 |
| South Americans | 50.0 /100 | #174 | Average $39,698 |
| Immigrants | South America | 47.2 /100 | #175 | Average $39,643 |
| Nigerians | 47.0 /100 | #176 | Average $39,641 |
| Costa Ricans | 46.1 /100 | #177 | Average $39,622 |
| Slavs | 45.6 /100 | #178 | Average $39,613 |
| Immigrants | Germany | 45.1 /100 | #179 | Average $39,603 |
| Immigrants | Kenya | 41.6 /100 | #180 | Average $39,535 |
| Tsimshian | 41.4 /100 | #181 | Average $39,530 |
| Tlingit-Haida | 40.5 /100 | #182 | Average $39,513 |