Fijian vs Immigrants from South America Median Female Earnings
COMPARE
Fijian
Immigrants from South America
Median Female Earnings
Median Female Earnings Comparison
Fijians
Immigrants from South America
$35,114
MEDIAN FEMALE EARNINGS
0.0/ 100
METRIC RATING
306th/ 347
METRIC RANK
$39,643
MEDIAN FEMALE EARNINGS
47.2/ 100
METRIC RATING
175th/ 347
METRIC RANK
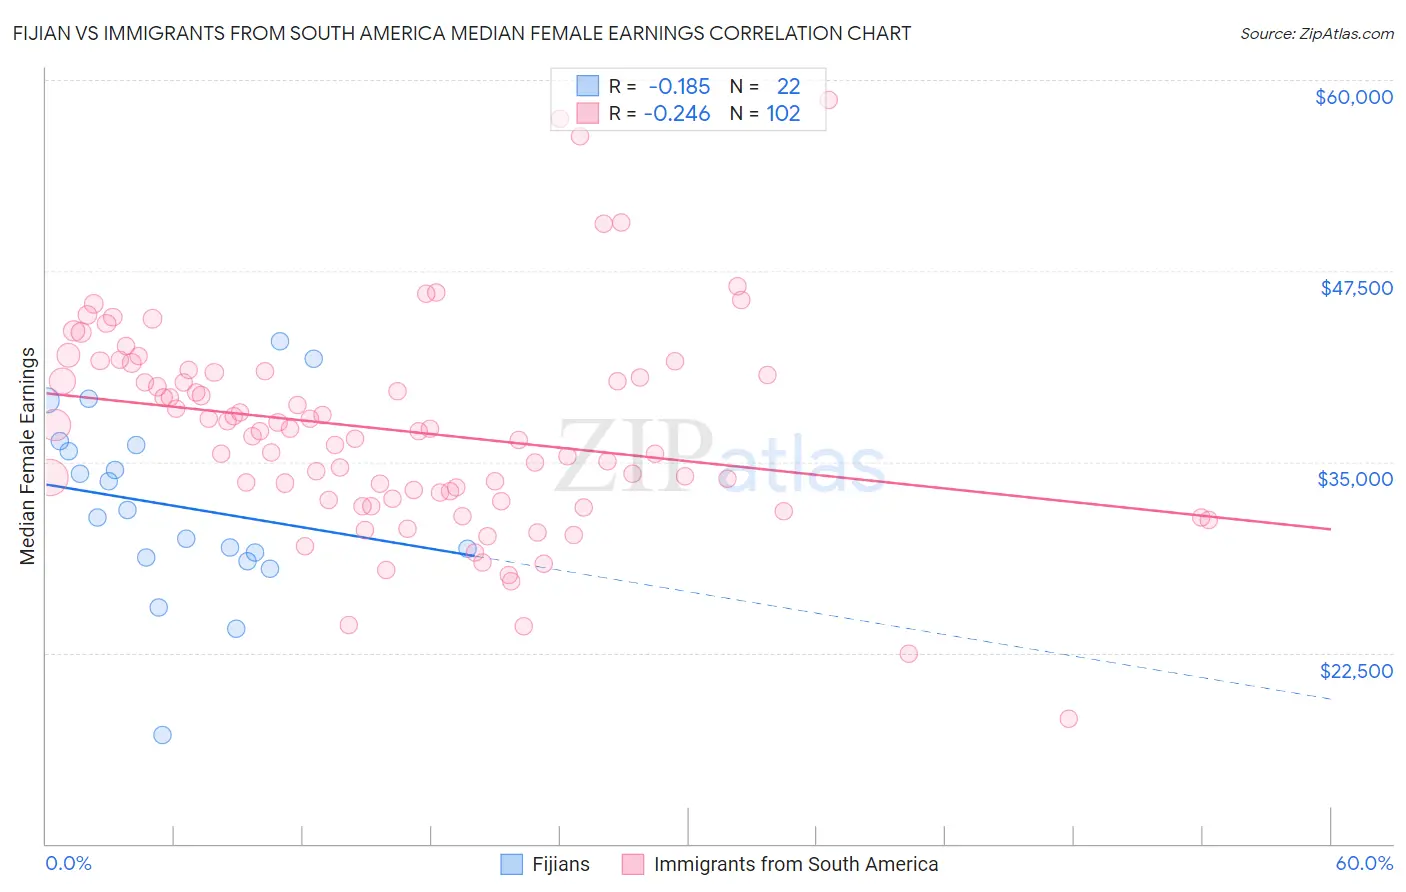
Fijian vs Immigrants from South America Median Female Earnings Correlation Chart
The statistical analysis conducted on geographies consisting of 55,944,407 people shows a poor negative correlation between the proportion of Fijians and median female earnings in the United States with a correlation coefficient (R) of -0.185 and weighted average of $35,114. Similarly, the statistical analysis conducted on geographies consisting of 486,047,092 people shows a weak negative correlation between the proportion of Immigrants from South America and median female earnings in the United States with a correlation coefficient (R) of -0.246 and weighted average of $39,643, a difference of 12.9%.
Median Female Earnings Correlation Summary
| Measurement | Fijian | Immigrants from South America |
| Minimum | $17,125 | $18,150 |
| Maximum | $42,895 | $58,709 |
| Range | $25,770 | $40,559 |
| Mean | $32,097 | $37,049 |
| Median | $31,625 | $37,037 |
| Interquartile 25% (IQ1) | $28,766 | $32,572 |
| Interquartile 75% (IQ3) | $36,076 | $40,849 |
| Interquartile Range (IQR) | $7,310 | $8,277 |
| Standard Deviation (Sample) | $6,055 | $6,851 |
| Standard Deviation (Population) | $5,916 | $6,817 |
Similar Demographics by Median Female Earnings
Demographics Similar to Fijians by Median Female Earnings
In terms of median female earnings, the demographic groups most similar to Fijians are Bahamian ($35,125, a difference of 0.030%), Sioux ($35,063, a difference of 0.15%), Immigrants from Bahamas ($35,027, a difference of 0.25%), Honduran ($35,013, a difference of 0.29%), and Chippewa ($35,003, a difference of 0.32%).
| Demographics | Rating | Rank | Median Female Earnings |
| Immigrants | Guatemala | 0.0 /100 | #299 | Tragic $35,444 |
| Yuman | 0.0 /100 | #300 | Tragic $35,377 |
| Pima | 0.0 /100 | #301 | Tragic $35,326 |
| Blacks/African Americans | 0.0 /100 | #302 | Tragic $35,315 |
| Immigrants | Latin America | 0.0 /100 | #303 | Tragic $35,307 |
| Crow | 0.0 /100 | #304 | Tragic $35,266 |
| Bahamians | 0.0 /100 | #305 | Tragic $35,125 |
| Fijians | 0.0 /100 | #306 | Tragic $35,114 |
| Sioux | 0.0 /100 | #307 | Tragic $35,063 |
| Immigrants | Bahamas | 0.0 /100 | #308 | Tragic $35,027 |
| Hondurans | 0.0 /100 | #309 | Tragic $35,013 |
| Chippewa | 0.0 /100 | #310 | Tragic $35,003 |
| Ute | 0.0 /100 | #311 | Tragic $34,960 |
| Yaqui | 0.0 /100 | #312 | Tragic $34,943 |
| Cubans | 0.0 /100 | #313 | Tragic $34,942 |
Demographics Similar to Immigrants from South America by Median Female Earnings
In terms of median female earnings, the demographic groups most similar to Immigrants from South America are Nigerian ($39,641, a difference of 0.010%), Costa Rican ($39,622, a difference of 0.050%), Slavic ($39,613, a difference of 0.080%), Immigrants from Germany ($39,603, a difference of 0.10%), and South American ($39,698, a difference of 0.14%).
| Demographics | Rating | Rank | Median Female Earnings |
| Immigrants | Peru | 58.9 /100 | #168 | Average $39,871 |
| Kenyans | 58.4 /100 | #169 | Average $39,860 |
| Slovenes | 56.2 /100 | #170 | Average $39,817 |
| Immigrants | Portugal | 54.7 /100 | #171 | Average $39,788 |
| British | 53.8 /100 | #172 | Average $39,772 |
| Canadians | 51.4 /100 | #173 | Average $39,724 |
| South Americans | 50.0 /100 | #174 | Average $39,698 |
| Immigrants | South America | 47.2 /100 | #175 | Average $39,643 |
| Nigerians | 47.0 /100 | #176 | Average $39,641 |
| Costa Ricans | 46.1 /100 | #177 | Average $39,622 |
| Slavs | 45.6 /100 | #178 | Average $39,613 |
| Immigrants | Germany | 45.1 /100 | #179 | Average $39,603 |
| Immigrants | Kenya | 41.6 /100 | #180 | Average $39,535 |
| Tsimshian | 41.4 /100 | #181 | Average $39,530 |
| Tlingit-Haida | 40.5 /100 | #182 | Average $39,513 |